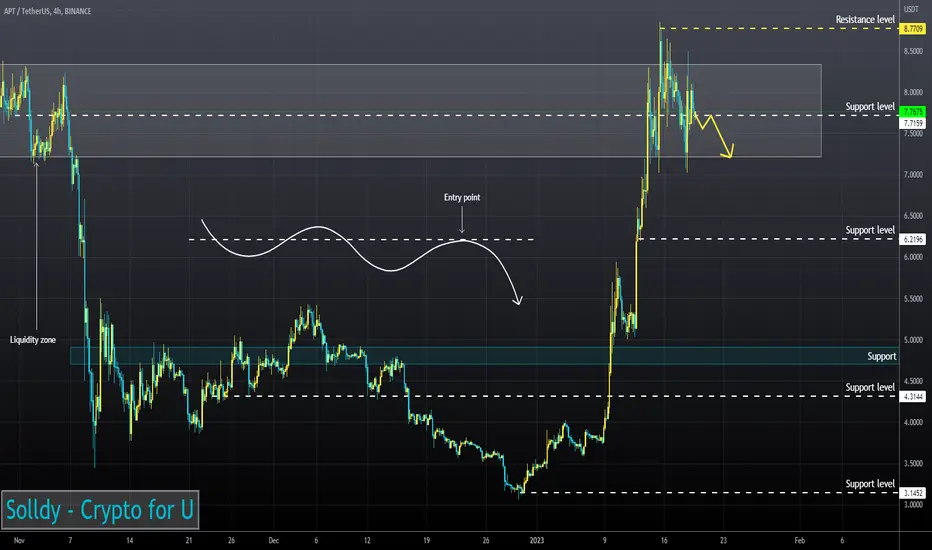
APT has consolidated under 50EMA (1H TF)
RSI chart has fallen into bearish zone (1H and 30m TFs)
Expect a correction if price holds at the bottom of the liquidity zone.
RSI chart has fallen into bearish zone (1H and 30m TFs)
Expect a correction if price holds at the bottom of the liquidity zone.
Disclaimer
The information and publications are not meant to be, and do not constitute, financial, investment, trading, or other types of advice or recommendations supplied or endorsed by TradingView. Read more in the Terms of Use.
Disclaimer
The information and publications are not meant to be, and do not constitute, financial, investment, trading, or other types of advice or recommendations supplied or endorsed by TradingView. Read more in the Terms of Use.