Price and RSI chart have formed a bullish divergence (4H and 1H TFs)
APT tests 50EMA and 200EMA as support levels (30m TF)
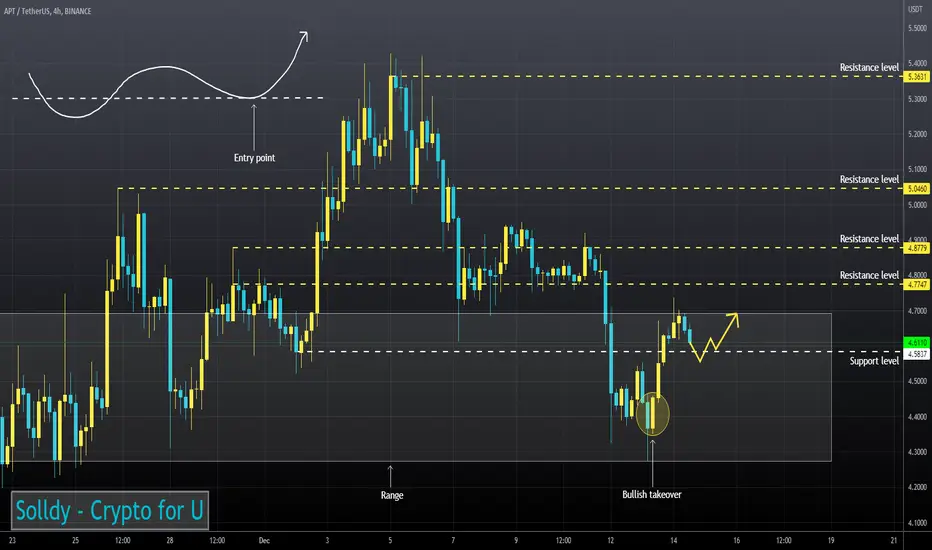
I expect the asset to continue to test the support level, but after fixing above it will continue to rise. Further price movement will depend on its reaction to the upper boundary of the range.
APT tests 50EMA and 200EMA as support levels (30m TF)
I expect the asset to continue to test the support level, but after fixing above it will continue to rise. Further price movement will depend on its reaction to the upper boundary of the range.
Related publications
Disclaimer
The information and publications are not meant to be, and do not constitute, financial, investment, trading, or other types of advice or recommendations supplied or endorsed by TradingView. Read more in the Terms of Use.
Related publications
Disclaimer
The information and publications are not meant to be, and do not constitute, financial, investment, trading, or other types of advice or recommendations supplied or endorsed by TradingView. Read more in the Terms of Use.