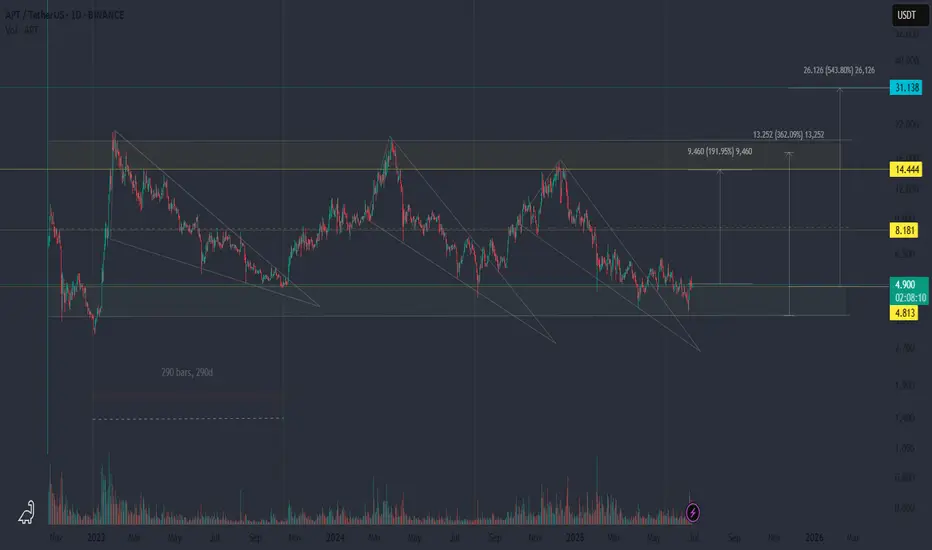
APT/USDT is showing a repeating cyclical structure — three times price has broken out of a falling wedge, each followed by a sharp rally.
📈 Historically:
▪️ Each breakout led to +150% or more gains
▪️ We’re now seeing a third similar setup forming
▪️ Targets (based on previous expansions): 8.18 / 14.44 / 31.138
📉 What if price dips again?
▪️ A pullback toward the lower boundary of the outer channel wouldn't be bearish
▪️ Structurally, it may align with the ongoing accumulation zone
⚠️ Reminder:
Even in a bullish setup, stop-loss sweeps and fakeouts are common, especially in uncertain market conditions.
Be adaptive — the structure matters more than the noise.
Disclaimer
The information and publications are not meant to be, and do not constitute, financial, investment, trading, or other types of advice or recommendations supplied or endorsed by TradingView. Read more in the Terms of Use.
Disclaimer
The information and publications are not meant to be, and do not constitute, financial, investment, trading, or other types of advice or recommendations supplied or endorsed by TradingView. Read more in the Terms of Use.