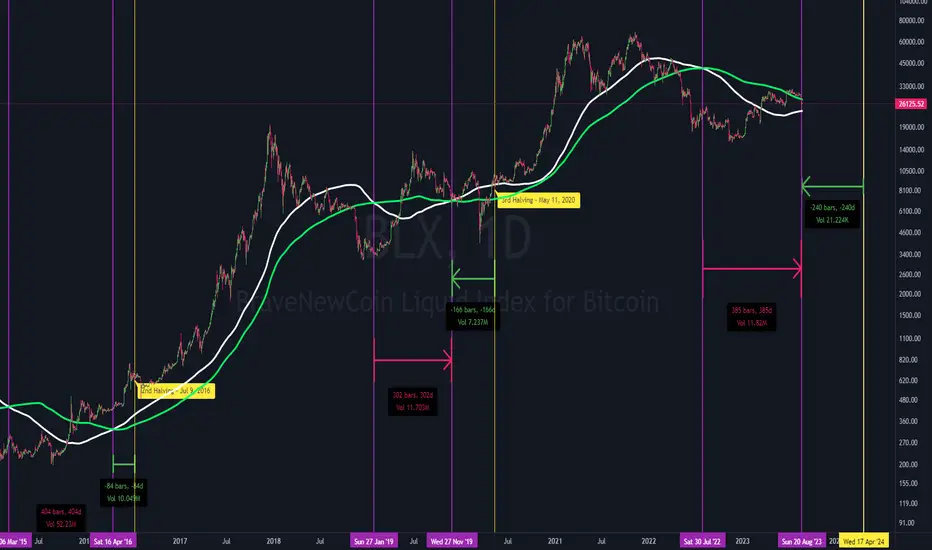
White Line = 365 SMA
Green Line = 600 SMA
Asset = Bitcoin
Patterns observable in this chart:
1. When the Bitcoin Halving occurs, the 365 SMA is already above the 600.
2. The Golden Cross of 365 and 600 occurs earlier than previous cycle.
- In the 2nd Halving, 80+ bars
- In the 3rd Halving, 160+ bars
- In the 4th Halving, "probably" 200+ bars
3. That the Death Cross takes 350 days in average.
Disclaimer
The information and publications are not meant to be, and do not constitute, financial, investment, trading, or other types of advice or recommendations supplied or endorsed by TradingView. Read more in the Terms of Use.
Disclaimer
The information and publications are not meant to be, and do not constitute, financial, investment, trading, or other types of advice or recommendations supplied or endorsed by TradingView. Read more in the Terms of Use.