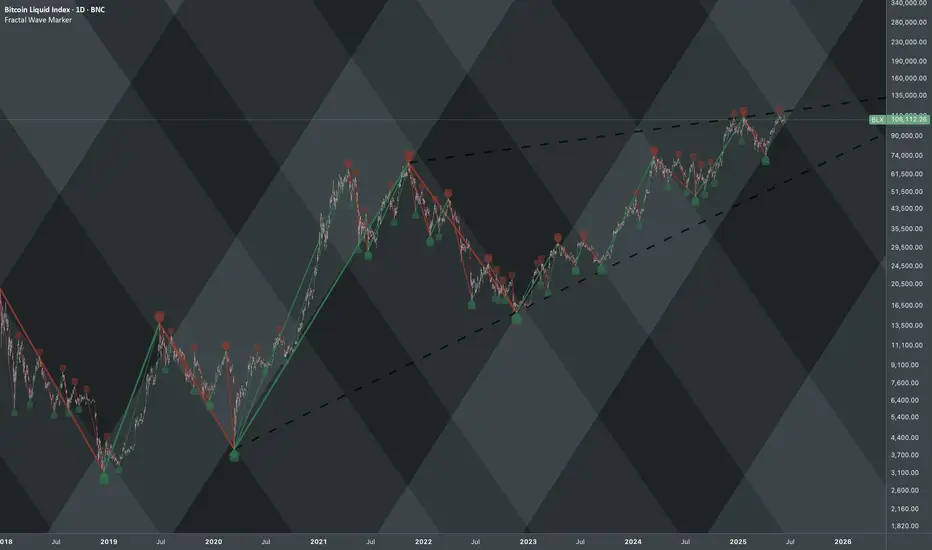
The Final Parabola: What History Says About Bitcoin’s July MovesIf you’ve been following here for a while, you know we’ve been nearly pinpoint in calling all the moves for Bitcoin. The altcoin market, not so much, but check out previous TAs to catch up on my perspective.
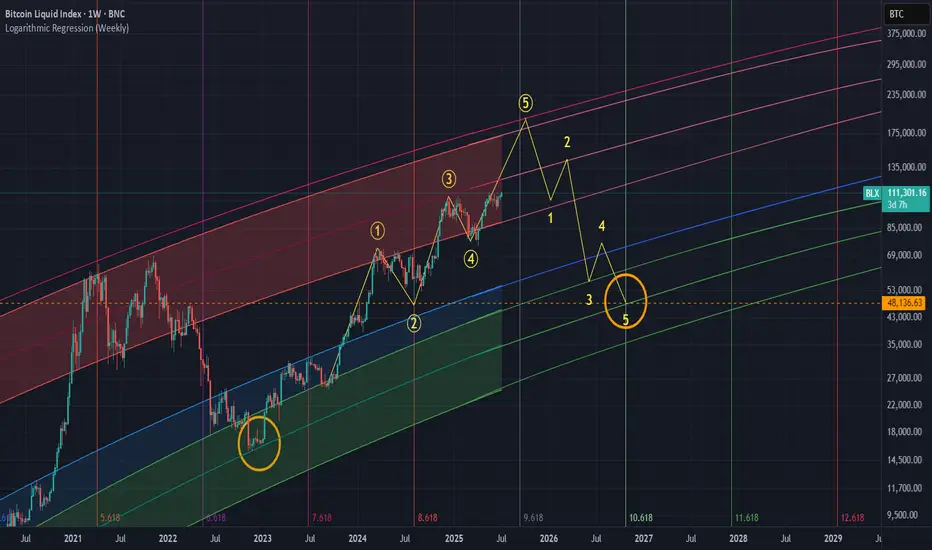
The two wave counts you see on the main chart have been in place for many months, I believe
Key data points
Previous close
—
Open
—
Day's range
—
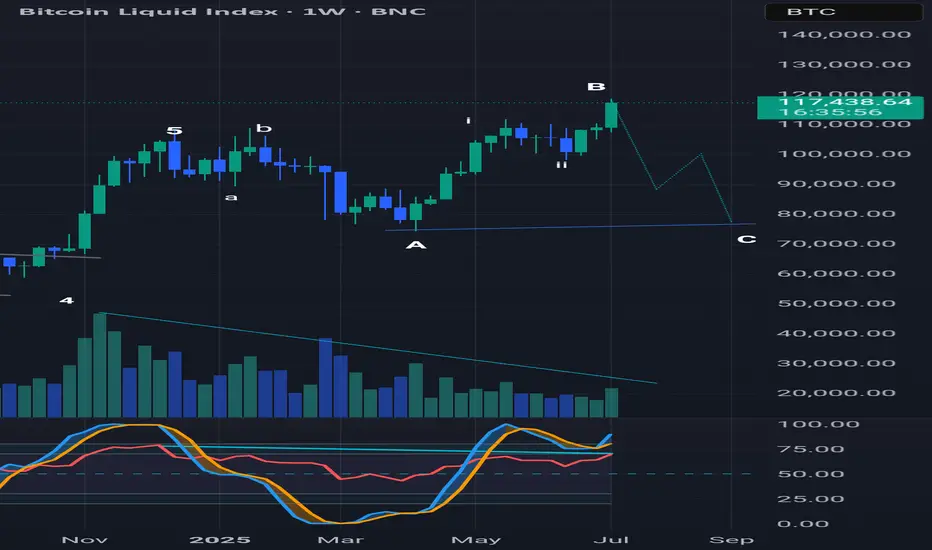
Running flat? Weekly chart wave analysisA running flat is where the B wave exceeds the starting point of wave A and the subsequent drop of wave C does not exceed the wave A low. Also note the declining volume and bearish divergence with the RSI on the weekly (and monthly) chart suggesting this move up is losing momentum.
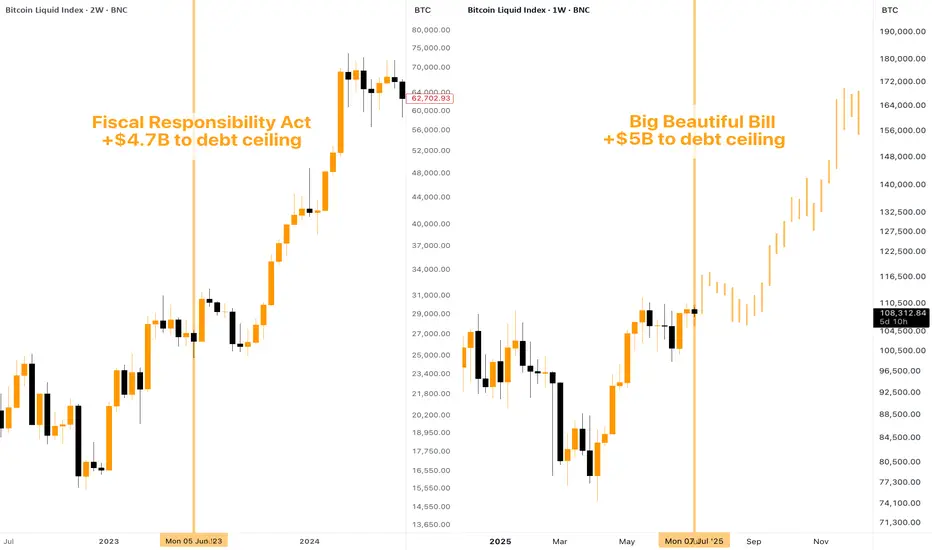
BIG BEAUTIFUL BILL - Markets are Ready to PUMP Again! At the 4th of July, the Independence Day, the "One Big Beautiful Bill Act" was signed into law by President Trump. In this idea I want to take a closer look at some points of this law and explain why I consider it VERY bullish for most of financial markets, and especially for crypto.
Here are
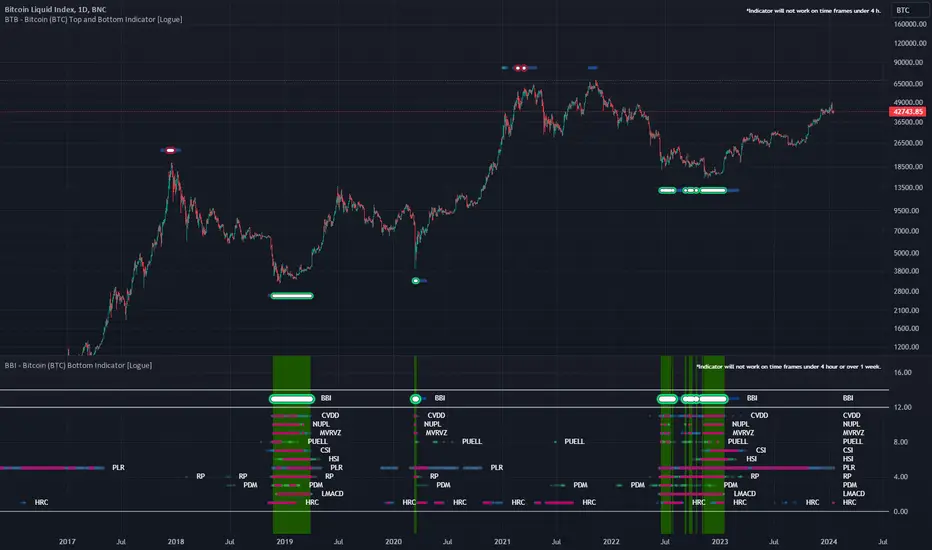
Hash rate capitulationThe hash rate capitulation (HRC) indicator used in the Bitcoin Bottom Indictor (BBI) has fired. The HRC indicator measures the rate of change of the hash rate. Steadily increasing hash rate is a sign of health of the bitcoin network. This indicator uses moving averages (20- and 100-day) of the hash
Bitcoin Log Regression 👀#Bitcoin Log Regression 👀
The orange line, as in the previous cycle, offers strong resistance.
💡I think CRYPTOCAP:BTC will stay at the current mark for another month. After that, we go to the correction, most likely it will not be a deep correction, but rather a consolidation.
This is indicated
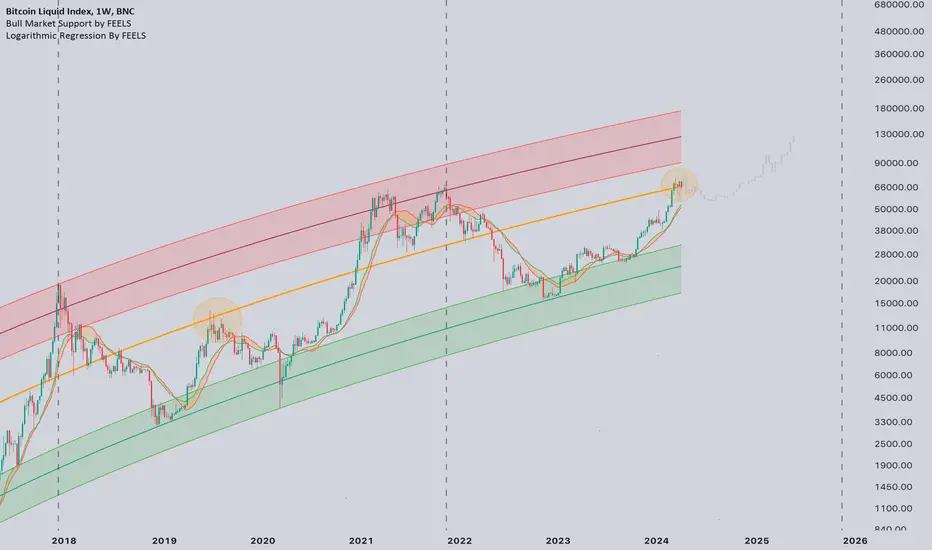
BTC reached the local peak? 👀#Bitcoin distance from BMS
Below is the oscillator, which shows how far the price has moved away from the bull market support. Mostly when we are in the 2-3 year of the cycle, the mark on the oscillator 40 acts as resistance, which indicates a mid-cycle peak.
Can it be different this time?🤔
Let'

Bitcoin: Higher Degree Wave DimensionsA new long-term pattern has been identified. Essentially a stretched version of the chart shown here:
This resemblance holds to some extent, as the coordinates are anchored to relatively longer cycles:https://tradingview.sweetlogin.com/x/PUxSDlLx/
Publishing this one in raw form (intentionally minimal) j
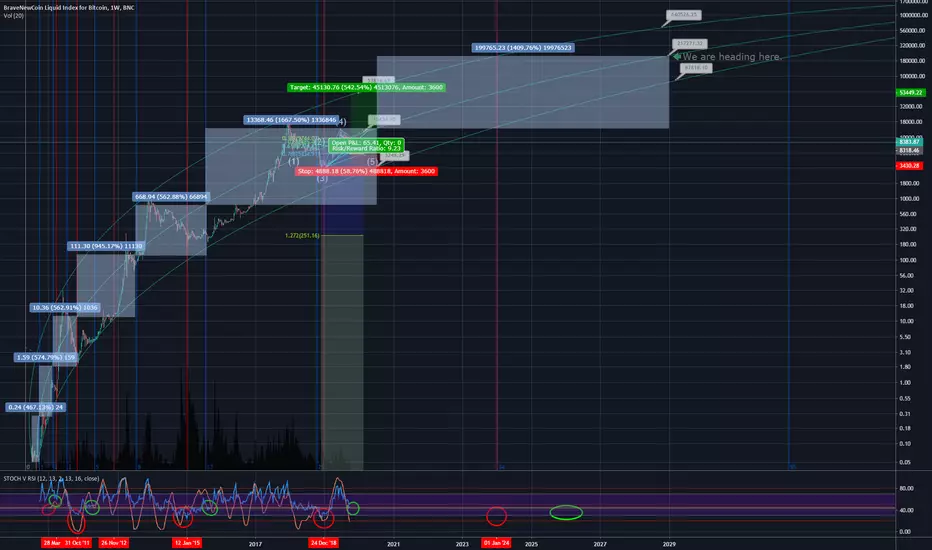
We are heading here12k is the average price of the market at the moment. we might 14x / 24x (depending on where you are starting) in the next ten years. BTC will be at around 200k $ at that time.

Bearish Logaritmic Regression AnalysisResume
This advanced logarithmic regression predicts we are about to reach top in the middle-late June. To start a bearish long term trend.
Discussion Analysis:
To extrapolate the current logarithmic regression trend. I tried to fit a sinusoidal wave to the logarithmic regression trend. The fit

See all ideas
Displays a symbol's price movements over previous years to identify recurring trends.