US Dollar Seasonal Patterns
We usually look at charts in chronological order, day after day and year after year. These typical chart types show the price path of an asset or Index over days, weeks, months, or years and provide a lot of information for technicians to use. Yet, there is another way to view charts, and that is to look at them seasonally.
A seasonal chart shows the tendencies of an asset or Index to move higher or lower, or peak and bottom, at specific points during the year.

The chart shows the tendencies of the US Dollar Index over the last 15 and 33 years. Over these two time periods, while there are variations, overall, the tendencies are quite similar.
- The start of the year into early March has an upward bias. Although, over the last 15 years, the bias has been neutral (sideways), with only early January and mid-February to early March being strong.
- By mid-March, the Index is often near a peak and starting to decline.
- The Index has a downward bias into the end of April, where it often bottoms in late April or early May. Hence why btc had crazy
- May is often a strong month, seeing the price rise again.
- June through early July is a choppy period. There is a slight upward bias, but the price tends to whipsaw up and down a fair bit.
- Early July usually sees the price peak and starts a multi-month bearish period. The price is weak into mid-October.
- Mid-October is a bottoming period of the US Dollar Index, and it is strong into mid-November.
- In mid-November, another bearish period starts and lasts until the end of the year. Although, the first half of December tends to have an upward bias, followed by a downward bias into the end of the year.
- The chart below provides a more general guideline of which months are bullish or bearish for the US Dollar Index. As noted above, some pretty big moves start early, in the middle, or late in a month, so the prior chart is more detailed in that regard.
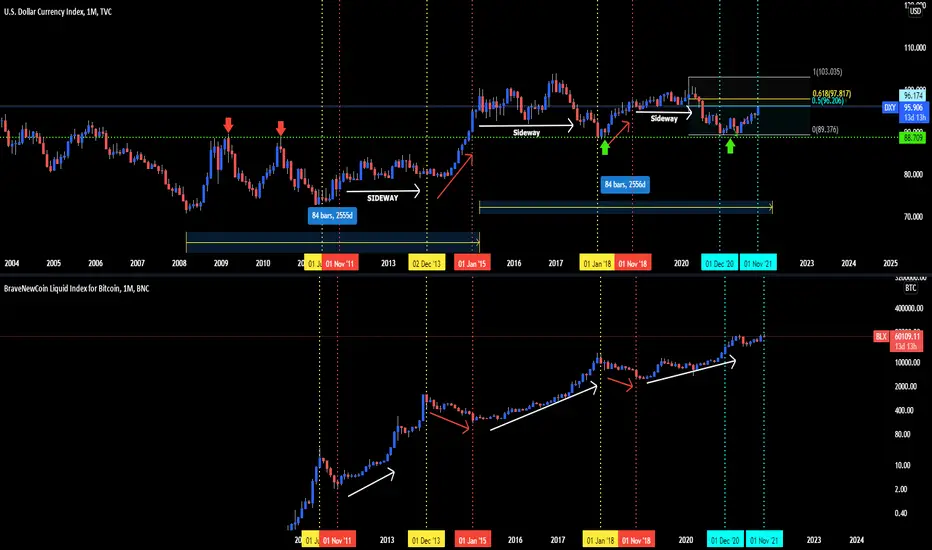
DXY is could be facing Resistance 0.96 – 0.97. RSI is also way overbought with bearish divergence; looking at DXY seasonality, I expect DXY to take some pause end of November and December. This gives bitcoin the chance to print new high.
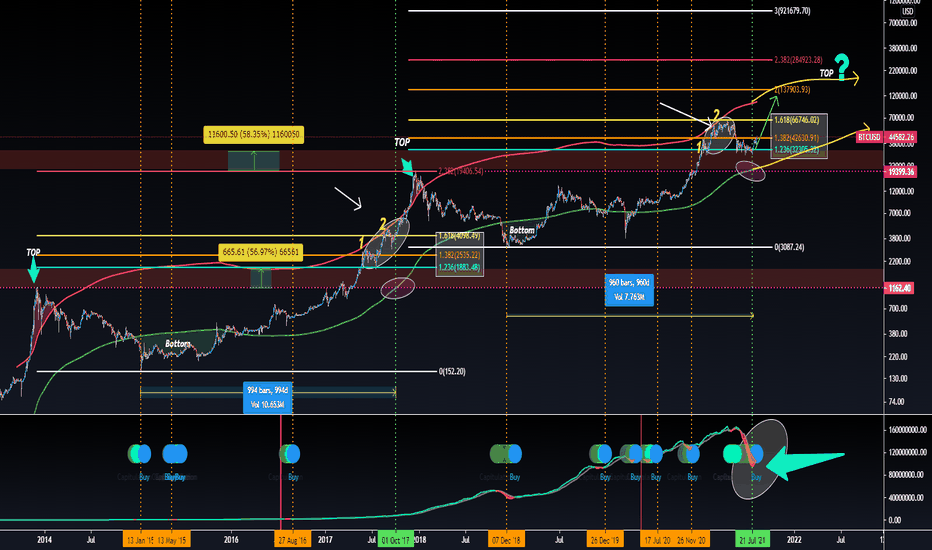
Long term play BTC:
The chart below provides other information. The number on the top of the column shows how often (%) the price moved higher in that month over the last 20 years. The number at the bottom of the column gives the average percentage rise or decline.

Source: StockCharts.com
Seasonality is an average, not a rule. In any given year, the price can deviate from the seasonal tendency, and traders shouldn’t fight it. Alway manage risk on every trade.
Seasonality is not a tool to use on its own but rather should be combined with price pattern analysis to determine entry and exit points. Yet seasonality does provide us with windows of time where we can watch for trend reversals or trends and feel more confident in our analysis.
We usually look at charts in chronological order, day after day and year after year. These typical chart types show the price path of an asset or Index over days, weeks, months, or years and provide a lot of information for technicians to use. Yet, there is another way to view charts, and that is to look at them seasonally.
A seasonal chart shows the tendencies of an asset or Index to move higher or lower, or peak and bottom, at specific points during the year.
The chart shows the tendencies of the US Dollar Index over the last 15 and 33 years. Over these two time periods, while there are variations, overall, the tendencies are quite similar.
- The start of the year into early March has an upward bias. Although, over the last 15 years, the bias has been neutral (sideways), with only early January and mid-February to early March being strong.
- By mid-March, the Index is often near a peak and starting to decline.
- The Index has a downward bias into the end of April, where it often bottoms in late April or early May. Hence why btc had crazy
- May is often a strong month, seeing the price rise again.
- June through early July is a choppy period. There is a slight upward bias, but the price tends to whipsaw up and down a fair bit.
- Early July usually sees the price peak and starts a multi-month bearish period. The price is weak into mid-October.
- Mid-October is a bottoming period of the US Dollar Index, and it is strong into mid-November.
- In mid-November, another bearish period starts and lasts until the end of the year. Although, the first half of December tends to have an upward bias, followed by a downward bias into the end of the year.
- The chart below provides a more general guideline of which months are bullish or bearish for the US Dollar Index. As noted above, some pretty big moves start early, in the middle, or late in a month, so the prior chart is more detailed in that regard.
DXY is could be facing Resistance 0.96 – 0.97. RSI is also way overbought with bearish divergence; looking at DXY seasonality, I expect DXY to take some pause end of November and December. This gives bitcoin the chance to print new high.
Long term play BTC:
The chart below provides other information. The number on the top of the column shows how often (%) the price moved higher in that month over the last 20 years. The number at the bottom of the column gives the average percentage rise or decline.
Source: StockCharts.com
Seasonality is an average, not a rule. In any given year, the price can deviate from the seasonal tendency, and traders shouldn’t fight it. Alway manage risk on every trade.
Seasonality is not a tool to use on its own but rather should be combined with price pattern analysis to determine entry and exit points. Yet seasonality does provide us with windows of time where we can watch for trend reversals or trends and feel more confident in our analysis.
Note
This could end up very A BEARISH RETEST AND IT COULD go side between 0.92- 0.96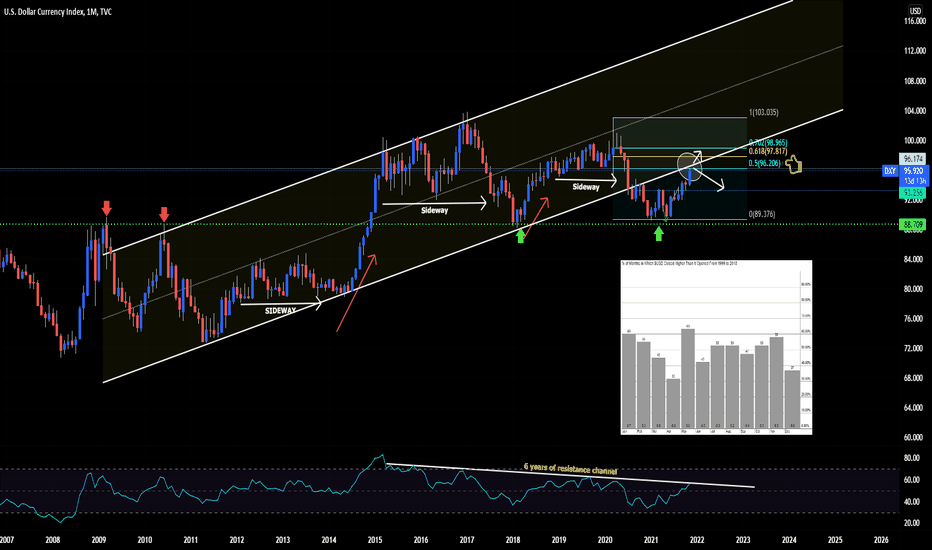
Disclaimer
The information and publications are not meant to be, and do not constitute, financial, investment, trading, or other types of advice or recommendations supplied or endorsed by TradingView. Read more in the Terms of Use.
Disclaimer
The information and publications are not meant to be, and do not constitute, financial, investment, trading, or other types of advice or recommendations supplied or endorsed by TradingView. Read more in the Terms of Use.