If you’ve been following here for a while, you know we’ve been nearly pinpoint in calling all the moves for Bitcoin. The altcoin market, not so much, but check out previous TAs to catch up on my perspective.
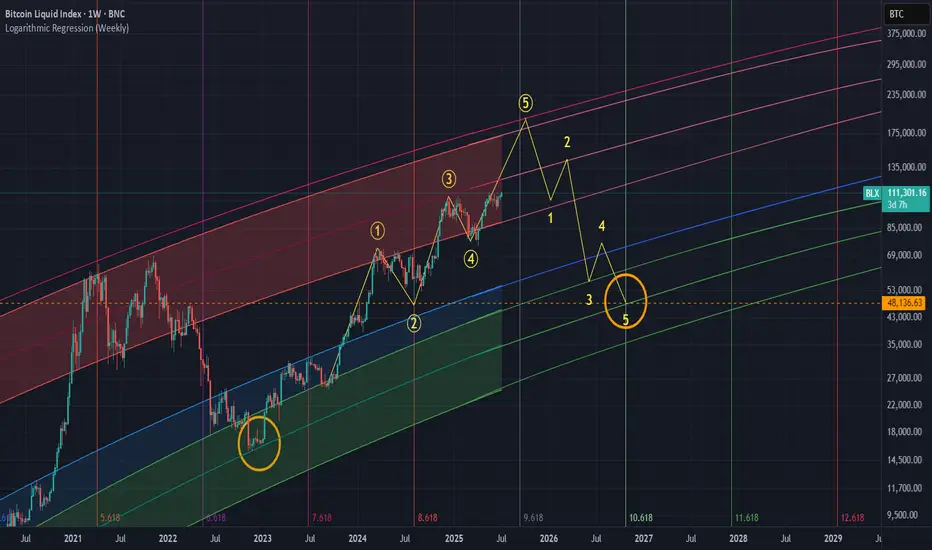
The two wave counts you see on the main chart have been in place for many months, I believe since around October 2024. As you can see, things have been playing out perfectly so far. The four year cycle continues to follow its path.
If the same thing happens this cycle like the last two, we should see a top sometime between October and December 2025, anywhere from 185K to 225K, followed by a cycle low somewhere around 48K in October 2026.
Bitcoin’s Julys

Every July during the 4th cycle year, Bitcoin begins its final parabolic run. This has happened without fail since the beginning of the Bitcoin Index chart. July consistently marks a major bottom, and then it's off to the races. The “only up” period that follows typically lasts 4 to 6 months and happens just once every four years like clockwork.
Here we are once again, the 4th year of the cycle, in July. Bitcoin has just hit all time highs and we've had a Hash Ribbon buy signal.
The perfect storm is brewing. Like always, the stars align in the second half of the 4th year of the Bitcoin cycle.
Time Cycles and Fibs

Looking at this time wave chart, we can see that every two waves like clockwork have marked a top. The next major wave appears to land in December 2025.

If we zoom into this smaller time wave, it has pinpointed the bottom of every small wave so far. The fact that we are once again at a bottom in July during the 4th year of the Bitcoin cycle is just another sign of the magical stars aligning.

This smaller Fibonacci sequence I’ve been tracking has already hit twice and predicted two major moves. The next dates to watch are August 2025 and January 2026.
There’s plenty of talk about an extended cycle. But during the last bull run, many traders and analysts said the same thing. In the end, Bitcoin topped out at exactly the same timeframe as the previous cycles.
If we reach the top of this model in Q4 2025, and we see a Pi Cycle Top signal along with a Mayer Multiple over 2.0, that will be our trigger.
If you've been sidelined this entire time, it's now or never. You don’t want to be the one buying in at 185K in Q4 2025 when everyone is calling for a million dollars. The time to act is now.
The two wave counts you see on the main chart have been in place for many months, I believe since around October 2024. As you can see, things have been playing out perfectly so far. The four year cycle continues to follow its path.
If the same thing happens this cycle like the last two, we should see a top sometime between October and December 2025, anywhere from 185K to 225K, followed by a cycle low somewhere around 48K in October 2026.
Bitcoin’s Julys
Every July during the 4th cycle year, Bitcoin begins its final parabolic run. This has happened without fail since the beginning of the Bitcoin Index chart. July consistently marks a major bottom, and then it's off to the races. The “only up” period that follows typically lasts 4 to 6 months and happens just once every four years like clockwork.
Here we are once again, the 4th year of the cycle, in July. Bitcoin has just hit all time highs and we've had a Hash Ribbon buy signal.
The perfect storm is brewing. Like always, the stars align in the second half of the 4th year of the Bitcoin cycle.
Time Cycles and Fibs
Looking at this time wave chart, we can see that every two waves like clockwork have marked a top. The next major wave appears to land in December 2025.
If we zoom into this smaller time wave, it has pinpointed the bottom of every small wave so far. The fact that we are once again at a bottom in July during the 4th year of the Bitcoin cycle is just another sign of the magical stars aligning.
This smaller Fibonacci sequence I’ve been tracking has already hit twice and predicted two major moves. The next dates to watch are August 2025 and January 2026.
There’s plenty of talk about an extended cycle. But during the last bull run, many traders and analysts said the same thing. In the end, Bitcoin topped out at exactly the same timeframe as the previous cycles.
If we reach the top of this model in Q4 2025, and we see a Pi Cycle Top signal along with a Mayer Multiple over 2.0, that will be our trigger.
If you've been sidelined this entire time, it's now or never. You don’t want to be the one buying in at 185K in Q4 2025 when everyone is calling for a million dollars. The time to act is now.
Trade active
Peak of model is sitting at 220k in Mid -October 2025
Trade closed: target reached
Why can't I just update normal notes without been forced to select a trading option , forget about the trading title of "close " target".To Force a Crossover in ~90–145 days:
Bitcoin would likely need to rise to $100K–$120K, and hold:
At $100K:
111DMA would rapidly rise
350DMA × 2 would lag behind
After ~100 days, crossover likely
So: +72% price gain from today over 3–4 months
= Mid to Late Q4 2025 crossover possible
Summary
Metric Estimated Value
Price needed to cause cross $100K–$120K
Days needed to cause cross ~90–145 days
% gain from now ($58K) +72%–107%
Projected crossover window Oct–Dec 2025
Chat GPT has calculated what needs to happen for a Pi Cycle cross , wild lines up with my theory heavily
Disclaimer
The information and publications are not meant to be, and do not constitute, financial, investment, trading, or other types of advice or recommendations supplied or endorsed by TradingView. Read more in the Terms of Use.
Disclaimer
The information and publications are not meant to be, and do not constitute, financial, investment, trading, or other types of advice or recommendations supplied or endorsed by TradingView. Read more in the Terms of Use.