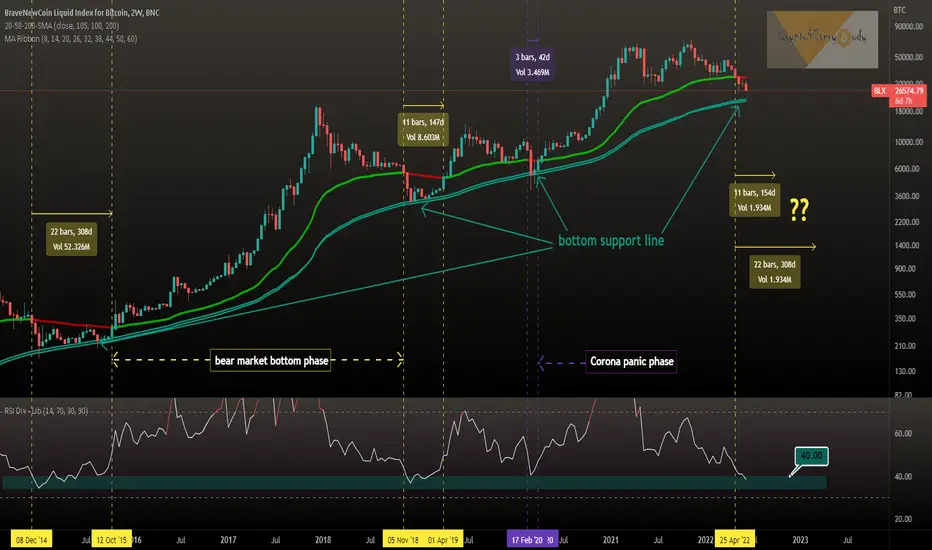
Bitcoin entering bear market bottom phase
This bear market bottom phase with MA Ribbon in red took 308 days in 2014/15 and 147 days in 2018/19.
The Corona panic phase only took 42 days while RSI didn't got below 40.
Please also consider the bottom support line to get an idea how deep BTC can go.
Any comments on this 2 week chart?
Drop me a nice comment if you'd like me to analyze any other cryptocurrency.
*not financial advice
do your own research before investing
The shown ideas are my personal opinion and findings... no financial advice
Please always do your own research before investing
Please always do your own research before investing
Related publications
Disclaimer
The information and publications are not meant to be, and do not constitute, financial, investment, trading, or other types of advice or recommendations supplied or endorsed by TradingView. Read more in the Terms of Use.