What is a Bollinger Band Squeeze?
• A Bollinger Band Squeeze describes a period in which volatility is extremely low. The narrowing of the Bollinger Bands signals low volatility.
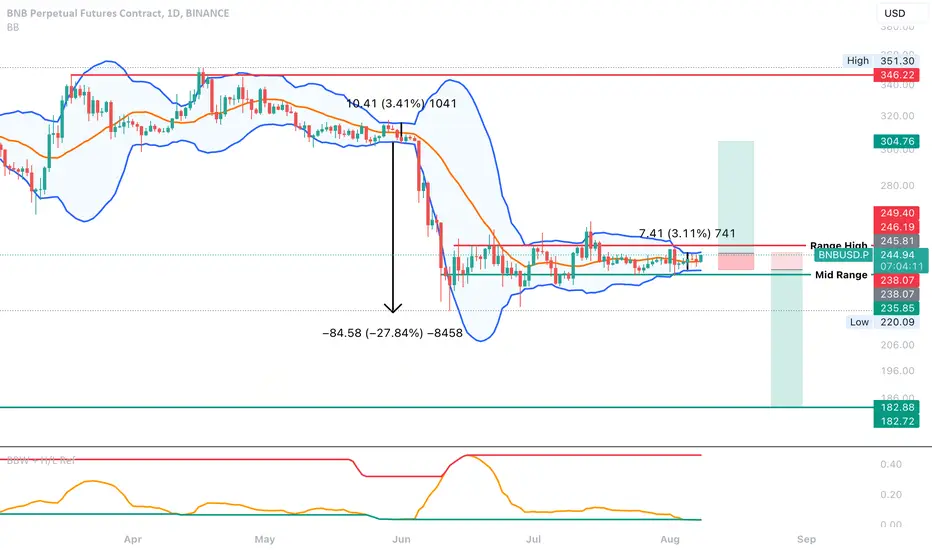
• There is a formula to calculate the level of the squeeze. However, for simplicity, I use the Bollinger BandWidth with High/Low References by Sinier, with a 180-day lookback period.
• You can look at the bottom indicator and see that the orange line, signifying the BB width is as low as it gets.
• According to Bollinger, periods of low volatility are often followed by periods of high volatility. It stands to reason that once the period of low volatility is over, a big move, up or down, will happen.
• For example, In may BNB was squeezed in a 3.41% range, and the following move was a 25% move.
How to determine the direction of the squeeze?
• The squeeze by itself, is a directionless signal.
• Bollinger suggests using momentum indicators, volume-based indicators, divergences, and classical TA techniques to determine the direction of the squeeze.
• Bollinger also suggests practical advice, based on market psychology: when the majority of traders point in the same direction, it’s usually a good idea to go in the opposite direction.
Trade idea:
• I couldn’t get a directional hint by using indicators. However, since we are in a range with clearly defined support and resistance levels, I will take this trade as a breakout trade.
• Support is 235 USDT. Resistance is 250USDT.
• You can take this trade at the break of the Bollinger band, to either side. Or, you can be more conservative and wait for a support resistance flip.
• The SL is the upper or lower boundary of the Bollinger band.
• A Bollinger Band Squeeze describes a period in which volatility is extremely low. The narrowing of the Bollinger Bands signals low volatility.
• There is a formula to calculate the level of the squeeze. However, for simplicity, I use the Bollinger BandWidth with High/Low References by Sinier, with a 180-day lookback period.
• You can look at the bottom indicator and see that the orange line, signifying the BB width is as low as it gets.
• According to Bollinger, periods of low volatility are often followed by periods of high volatility. It stands to reason that once the period of low volatility is over, a big move, up or down, will happen.
• For example, In may BNB was squeezed in a 3.41% range, and the following move was a 25% move.
How to determine the direction of the squeeze?
• The squeeze by itself, is a directionless signal.
• Bollinger suggests using momentum indicators, volume-based indicators, divergences, and classical TA techniques to determine the direction of the squeeze.
• Bollinger also suggests practical advice, based on market psychology: when the majority of traders point in the same direction, it’s usually a good idea to go in the opposite direction.
Trade idea:
• I couldn’t get a directional hint by using indicators. However, since we are in a range with clearly defined support and resistance levels, I will take this trade as a breakout trade.
• Support is 235 USDT. Resistance is 250USDT.
• You can take this trade at the break of the Bollinger band, to either side. Or, you can be more conservative and wait for a support resistance flip.
• The SL is the upper or lower boundary of the Bollinger band.
Disclaimer
The information and publications are not meant to be, and do not constitute, financial, investment, trading, or other types of advice or recommendations supplied or endorsed by TradingView. Read more in the Terms of Use.
Disclaimer
The information and publications are not meant to be, and do not constitute, financial, investment, trading, or other types of advice or recommendations supplied or endorsed by TradingView. Read more in the Terms of Use.