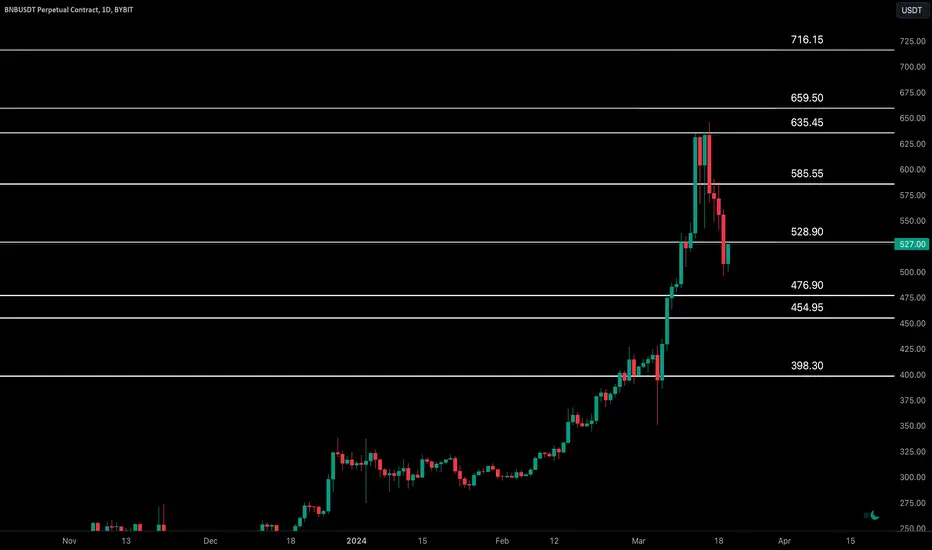
Binancecoin declined from the key resistance zone of $635-$660.
A sustained price action below $529 will push #BNB price lower to $455-$477.
A daily candle closure above the key daily resistance zone of $635-$660 is required for another bullish extension towards $716, the new ATH.
Intraday Chart

The BNBUSDT intraday chart is in the bearish territory below $548.
A re-test of the resistance zone of $463-$487 and a bullish rejection will lead to a bullish rally to $548.
A solid bullish break-out of $548 will push price higher towards $600.
A bearish break-out of $463-$487 will lead to a dip towards $407-$433 and, possibly lower.
A sustained price action below $529 will push #BNB price lower to $455-$477.
A daily candle closure above the key daily resistance zone of $635-$660 is required for another bullish extension towards $716, the new ATH.
Intraday Chart
The BNBUSDT intraday chart is in the bearish territory below $548.
A re-test of the resistance zone of $463-$487 and a bullish rejection will lead to a bullish rally to $548.
A solid bullish break-out of $548 will push price higher towards $600.
A bearish break-out of $463-$487 will lead to a dip towards $407-$433 and, possibly lower.
Related publications
Disclaimer
The information and publications are not meant to be, and do not constitute, financial, investment, trading, or other types of advice or recommendations supplied or endorsed by TradingView. Read more in the Terms of Use.
Related publications
Disclaimer
The information and publications are not meant to be, and do not constitute, financial, investment, trading, or other types of advice or recommendations supplied or endorsed by TradingView. Read more in the Terms of Use.