Hello
It's a Bitcoin Guide.
If you "follow"
You can receive real-time movement paths and comment notifications on major sections.
If my analysis was helpful,
Please click the booster button at the bottom.

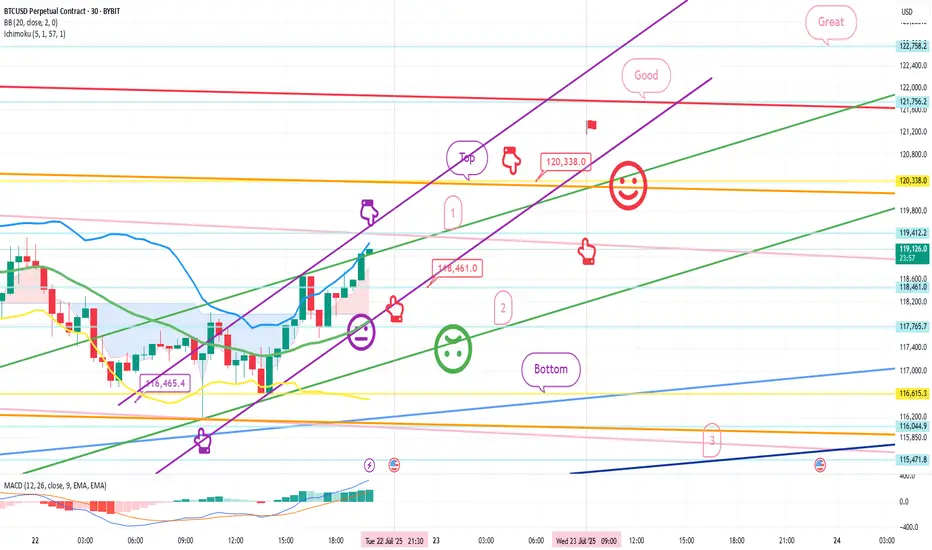
This is Bitcoin's 30-minute chart.
Nasdaq indicators will be released at 9:30 in a little while.
Although Bitcoin's mid-term pattern is broken,
it looks like a strong upward trend based on signals and candlestick positions.
In the case of Nasdaq, the 6-hour and 12-hour charts MACD dead cross is in progress,
and even if there is no plunge and only a sideways movement,
it seems likely that today's strategy will be successful.
In the bottom left, from the analysis article on the 18th,
the final long position entry point of $116,465.4 Bottom
is connected as is.
*Red finger movement path
One-way long position strategy
1. $118,461.9 long position entry section / green support line breakout, stop loss price
2. $120,338 long position 1st target -> Good, Great in order of target price
See the 1st section at the top as a touch section for an upward wave rather than a short position entry,
and if this section breaks through right away, an upward trend can be connected.
If the purple parallel line support line is maintained without breaking away,
there is a possibility of a vertical rise.
If the top section is touched,
after the first liquidation,
it would be good to use the 1st section to re-enter a long position.
The 2nd section at the bottom is important,
and if it is pushed to this section according to the movement of Nasdaq today,
it can fall strongly.
Please check the real-time support line shape.
From the breakout, Bottom -> 3 sections are open.
If you touch the 3rd section after tomorrow, the mid-term pattern will be restored.
This is the 12+ day section.
Up to this point, I ask that you simply use my analysis for reference and use only.
I hope that you will operate safely with the principle of trading and stop loss.
Thank you.
It's a Bitcoin Guide.
If you "follow"
You can receive real-time movement paths and comment notifications on major sections.
If my analysis was helpful,
Please click the booster button at the bottom.
This is Bitcoin's 30-minute chart.
Nasdaq indicators will be released at 9:30 in a little while.
Although Bitcoin's mid-term pattern is broken,
it looks like a strong upward trend based on signals and candlestick positions.
In the case of Nasdaq, the 6-hour and 12-hour charts MACD dead cross is in progress,
and even if there is no plunge and only a sideways movement,
it seems likely that today's strategy will be successful.
In the bottom left, from the analysis article on the 18th,
the final long position entry point of $116,465.4 Bottom
is connected as is.
*Red finger movement path
One-way long position strategy
1. $118,461.9 long position entry section / green support line breakout, stop loss price
2. $120,338 long position 1st target -> Good, Great in order of target price
See the 1st section at the top as a touch section for an upward wave rather than a short position entry,
and if this section breaks through right away, an upward trend can be connected.
If the purple parallel line support line is maintained without breaking away,
there is a possibility of a vertical rise.
If the top section is touched,
after the first liquidation,
it would be good to use the 1st section to re-enter a long position.
The 2nd section at the bottom is important,
and if it is pushed to this section according to the movement of Nasdaq today,
it can fall strongly.
Please check the real-time support line shape.
From the breakout, Bottom -> 3 sections are open.
If you touch the 3rd section after tomorrow, the mid-term pattern will be restored.
This is the 12+ day section.
Up to this point, I ask that you simply use my analysis for reference and use only.
I hope that you will operate safely with the principle of trading and stop loss.
Thank you.
Trade closed: target reached
HelloThis is Bitcoin Guide.
I will check the movement after writing the analysis article on July 22.
This is Bitcoin 30-minute chart.
I marked the main sections with black fingers.
At the bottom left, in the analysis article on the 18th,
connected the long position entry section 116,465.4$ strategy
and the red finger long position strategy.
I will organize it in order.
116,465.4$ long entry -> 1st purple finger at the top 119,412.2$ autonomous short
->118,461$ -> 2nd section 117,765.7$ long position entry
Without breaking the green support line stop loss price
reached the top section target price of 120,338$.
Up to this point, the strategy is perfect. I have processed it.
After that, it was pushed down in the long re-entry of the first section
and is breaking away from the green support line.
It is unfortunate that the last trend
has failed to renew.
I hope you trade on principle.
Thank you.
Note
HelloIt's a Bitcoin Guide.
I did a private brief analysis yesterday because I didn't have enough time.
I'll check the movement after writing the analysis on July 23.
This is Bitcoin's 30-minute chart.
I marked the main sections with black fingers.
In the red finger long position strategy,
Purple finger 119.2K -> Red finger 118.4.K long switching strategy
It failed to touch the upward wave confirmation section at the top,
and damaged the 2nd section and the green support line,
and finished the sideways movement.
Yesterday, after confirming the upward touch,
I canceled the strategy because it was a long position waiting strategy.
Today, as a new daily candle was created,
It touched 119.2K at the top -> fell to the bottom section.
The movement that didn't come out yesterday
first touched the downside, and then dropped significantly while bypassing.
It keeps shaking up and down,
I hope you operate well with principle trading.
Thank you.
Note
Hello,It's a Bitcoin Guide.
I think I've caught a heatwave.
It's been a bit difficult to be active lately.
Below, let's check the movement since my last analysis on July 24th.
This is a Bitcoin 30-minute chart.
I've marked the major sections with black fingers.
At the bottom left, the second long position entry point, entered on the 22nd, is marked with a purple finger at $117,765.7.
I've followed the strategy.
The light blue fingers are two-way neutral.
The strategy is a chase-buy -> short->long switching strategy.
After a chase-buy at $118,207.8,
the short position entry point at $119,634.5 was not touched,
and the price closed with a vertical decline.
After breaking below the purple support line, I cut my losses.
After touching $115,546.2, which I marked at the bottom on Saturday,
without breaking below the light blue support line, I reached the first short position entry point of $119,634.5, as described in the analysis on the 23rd.
A new gap was created below the bottom due to the weekend's movement.
I'll take a closer look to see what moves I see today.
This is partly due to theft and impersonation,
and since the basic participation rate isn't showing up,
I'll continue to operate privately.
Thank you.
Note
Hello,It's a Bitcoin Guide.
I'll check the movement since writing the analysis on July 29th.
This is a 30-minute chart of the Nasdaq.
While I don't upload separate analysis articles,
I do check patterns and trends daily.
If you look at the black fingers,
after hitting a new high at the top, it formed a sweeping pattern,
and then fell sharply from the 11:00 AM release.
This is a 30-minute chart of Bitcoin.
The key areas are marked with black fingers.
In the red finger long position strategy,
after entering a long position at $118,531.8, the green support line was broken.
After that, it touched the gap area marked below and began to rebound.
I've placed a stop loss on this strategy.
Yesterday's strategy was to hold on to the first major section during the vertical uptrend,
but it coupled with the Nasdaq Sweep at 11 o'clock,
and eventually fell to the gap.
It moves alone when it rises,
and together when it falls.
I'm wondering if I should just analyze it in words, without an entry point, stop-loss price, or target.
It could go up.
But it could also go down.
So, it could move sideways.
Since the next day has a 100% win rate, it's easy to deceive.
In any case,
the stop-loss order is a bit of a blow to my pride.
Starting today, I'll diligently analyze the Nasdaq again.
Today is an important day, right?
I'll continue this privately.
Thank you.
Note
Hello,It's a Bitcoin Guide.
I'll check the movement after writing the analysis on July 31st.
This is the Nasdaq 30-minute chart.
I've marked the key areas with black fingers.
Yesterday, the strategy was to switch from short to long in real time, or to wait for a short move if the price immediately declined.
As you can see, the price plummeted below the 4th light blue support line, without touching the 1st area at the top.
As you can see, there was no significant movement at the 9:30 AM indicator release.
If the price touches the 1st area and then declines,
it could be a sweeping shot.
Yesterday, it was a vertical decline,
but even though the full candlestick on the 4-hour chart was broken,
the price plummeted without any support or rebound.
This movement seems to indicate a downtrend,
but it's absurd that not even the slightest wave has occurred.
I also highlighted another key point today.
I'll explain the details in the analysis article.
This is a 30-minute Bitcoin chart.
I've marked the key sections with black fingers.
In the lower left corner,
I've connected the final long position entry point at $116,115, which is section 2 in the 70-day analysis article, with a purple finger.
After a rebound to just under $2,800,
yesterday, in line with the Nasdaq movement,
the strategy was to switch from short to long (light blue finger) or to wait long in section 1.
Without touching the short position entry point at the top, it continued to touch the long position entry point at $117,995.2 in the first section.
Afterwards, it rose to around $840,
but after touching the light blue finger at the top, the short position entry point at $118,794.6,
it connected with the Nasdaq and broke through the green support line.
The strategy is to cut losses.
Looking at the timeframe, Bitcoin held well,
but at 1:30 AM,
it experienced a sharp decline,
same time as the Nasdaq.
I explained that a downtrend could connect from the bottom->second section.
Today, when an additional daily candle was created, it broke through the dark pink support line at the bottom, $115,054.6.
The Nasdaq continued to hit new highs,
and Bitcoin, unable to break its all-time high,
was falling in a mindless crash, with minimal fluctuations.
Since analysis is practically meaningless,
it's a bit disheartening.
When it goes up, it goes up recklessly alone,
and when it falls, it falls together with the market in a similar fashion...
If you look at yesterday's movements,
you'll understand why principled trading and stop-loss prices are necessary, don't you?
An analysis that only talks about principled trading
but irresponsibly talks about all directions, up and down
without entry prices or stop-loss prices should be ignored.
An analysis has a 100% success rate, but the only people who have profited are close associates and agitators.
I hope you consider who such analysis is intended for.
I also placed a take-profit order near the all-time high.
I'm not sure if this suggests that Bitcoin will decline in the summer, starting in August.
But in times like these, you need to be vigilant and
practice principled trading. Because it's a market where someone else is losing and giving up, someone else is gaining.
As a living witness who has witnessed the entire process, from when Bitcoin was at 2.5 million won to its current value of 160 million won,
I believe that if you persevere through difficult times, profits will eventually follow.
The key to today's strategy seems to be the "major rebound zone."
I apologize, but today will be private.
Have a good weekend and keep up the good work.
Thank you.
*비트코인가이드 공식텔레그램 Telegram
t.me/BTG_Group
*빙엑스 BingX 50%DC+$5,000 (총1회수수료)
bingx.com/invite/YBM3A4
*바이비트 Bybit 20%DC+$5,020
partner.bybit.com/b/Bitcoin_Guide
*앞으로는 하단의 네이버카페에서만 활동합니다.
cafe.naver.com/loanlife82
t.me/BTG_Group
*빙엑스 BingX 50%DC+$5,000 (총1회수수료)
bingx.com/invite/YBM3A4
*바이비트 Bybit 20%DC+$5,020
partner.bybit.com/b/Bitcoin_Guide
*앞으로는 하단의 네이버카페에서만 활동합니다.
cafe.naver.com/loanlife82
Related publications
Disclaimer
The information and publications are not meant to be, and do not constitute, financial, investment, trading, or other types of advice or recommendations supplied or endorsed by TradingView. Read more in the Terms of Use.