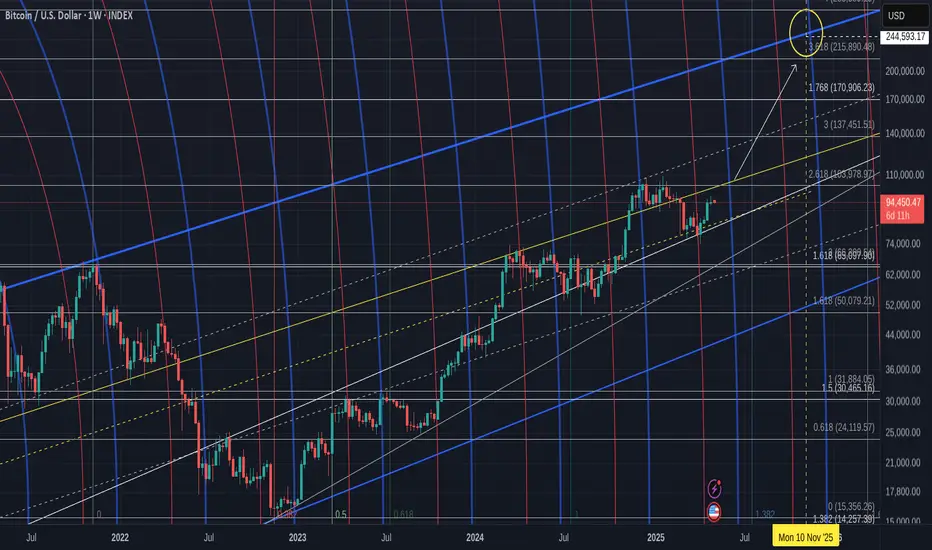
Bitcoin PA taking a breath of Air having pushed up off the lower trend line
Currently facing short term resistance as mentioned in the Daily chart just posted.
The Weekly MACD has yet to Croos its signal line ( red)
https://tradingview.sweetlogin.com/x/LMw24sUr/
There is currently little reason to expect this to not happen.
PA currently sits Mid point of its rising channel with strong support below. We may well stay in this area till Mid Month, depending on the Macro influences.
The projected ATH in the circle top right of chart is on the ATH line created sine the 2017 ATH top.
It is a projection and an Expectation but there is confluence with many charts as to this Cycle Top price range. There are charts that show a Much higher price, though I feel they are possibly more pointing towards the Next cycle Top in 2029 ( If the cycle pattern continue as they have since 2017 )
We are on the edge of moves higher and we just need to remain patient......
Nothing to be taken as Financial advice.
I will always say
"Only invest what you can afford to loose. When you are ready, take out your original investment. This way, it is only your profit that is at risk"
THAT is Financial advice
I will always say
"Only invest what you can afford to loose. When you are ready, take out your original investment. This way, it is only your profit that is at risk"
THAT is Financial advice
Disclaimer
The information and publications are not meant to be, and do not constitute, financial, investment, trading, or other types of advice or recommendations supplied or endorsed by TradingView. Read more in the Terms of Use.