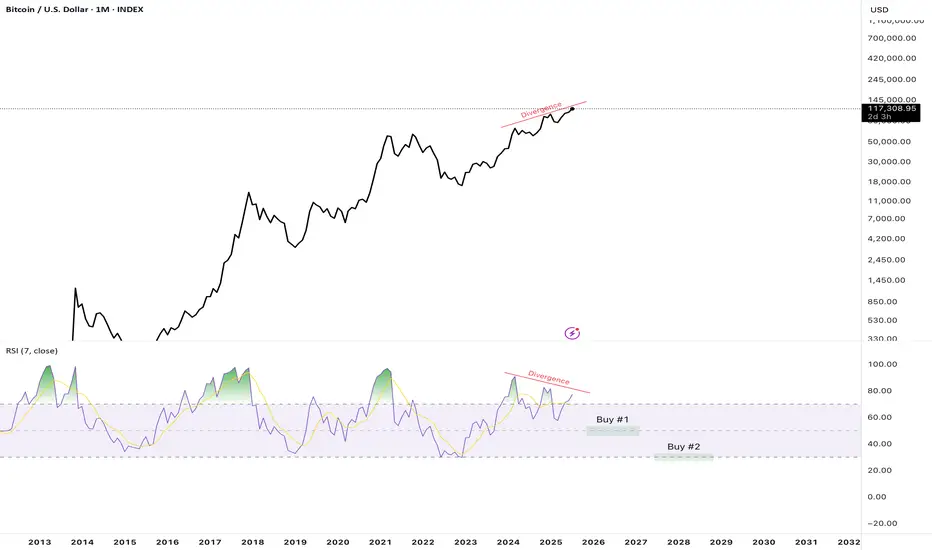
BTC getting ready to dump? Divergence like not yet seen on BTC MDivergence is one of the best indicators for potential price reversal... and BTC is building one like we've never seen before on monthly chart. Be extremely careful with your buy positions at this time, and make sure you save money for the next opportunities to get in big when the RSI hits lower. Go
Key data points
Previous close
—
Open
—
Day's range
—
About Bitcoin
Bitcoin is the world’s most traded cryptocurrency, and represents the largest piece of the crypto market pie. It was the first digital coin and as such, remains the most famous and widely-adopted cryptocurrency in the world. It's the original gangster in whose footsteps all other coins follow. The birth of Bitcoin was the genesis of an entirely new asset class, and a huge step away from traditional, centrally controlled money. Today, many advocates believe Bitcoin will facilitate the next stage for the global financial system, although this — of course — remains to be seen.
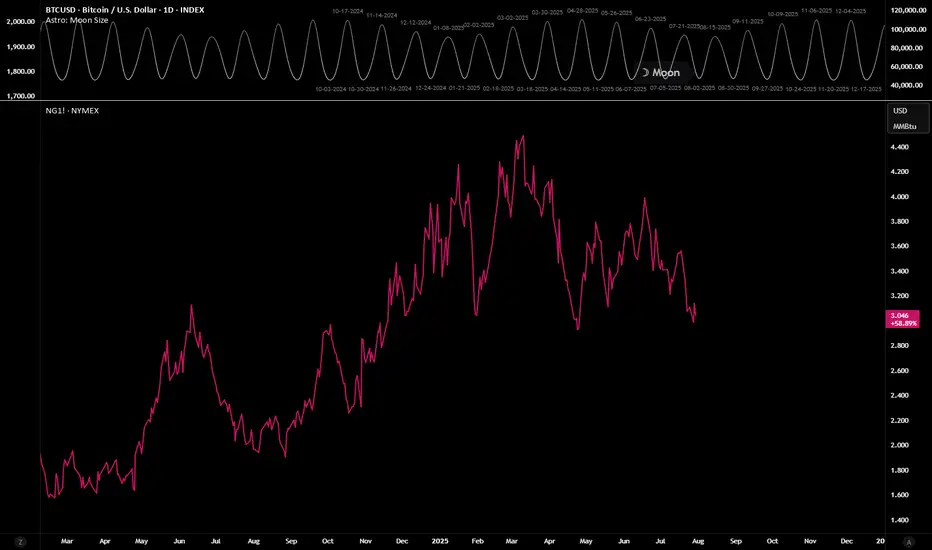
Using Astro: indicators on non-24/7 chartsWhen loading AstroLib powered Astro: indicators on non-24/7 assets like NatGas, you may notice the indicator has gaps and the plots are not smooth. A simple workaround is to pull up a BTC chart, load the indicator, merge the two panes, hide the BTC plots, and then compare the non-24/7 asset in anoth
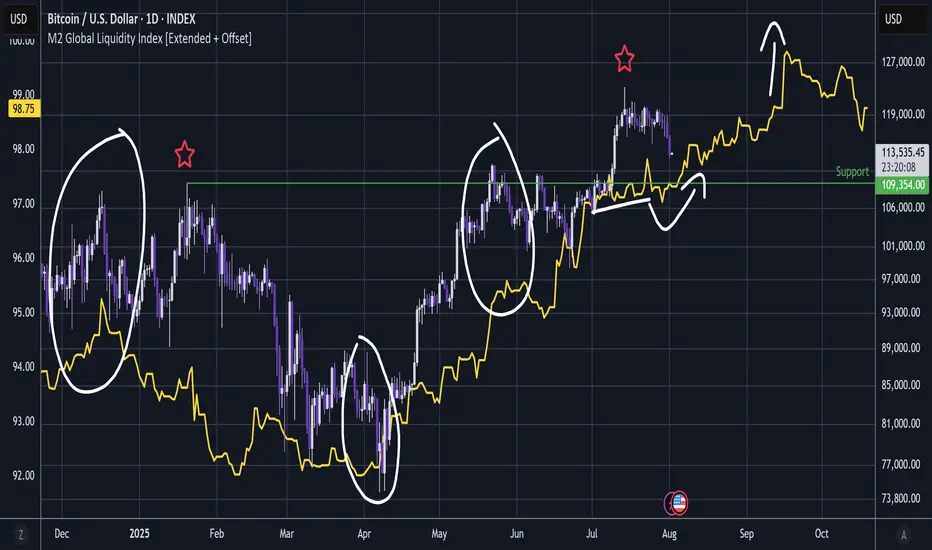
BITCOIN - M2 Global Liquidity Is Silver Lining ?BTC / M2 Global Liquidity (Offset 78 days)
History did repeat and the standout Shooting Star has again led to significant dump action as it .
And the fact that this is happening while stock indexes are wobbling while Trump unleashes more tariffs - should be a cause for concern.
But to lighten moo
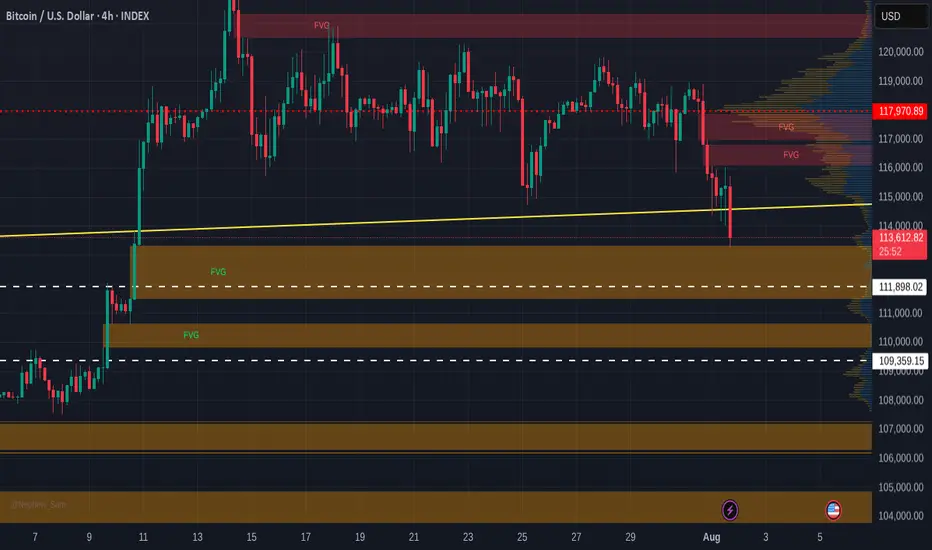
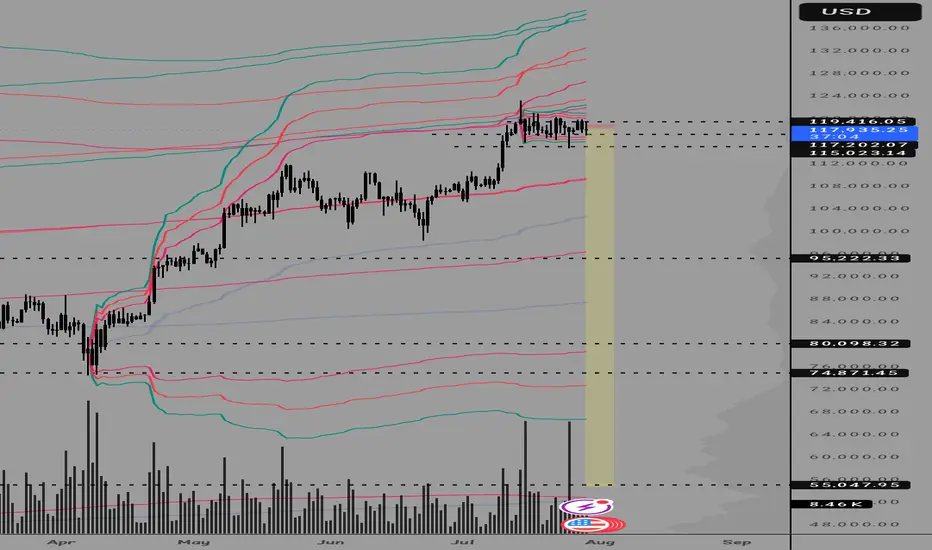
Bitcoin Free Value Gaps getting filled - 109 K target >
If you look back at the last time I posted a chart with Free Value Gaps ( FVG ) you will see an orange bar where PA currently sits...The reason it is no longer there is because it ogt "Filled"
It is much the sameidea as CME Gaps. Thay also get filled very often/
So, we can see 2 more FVG before 1
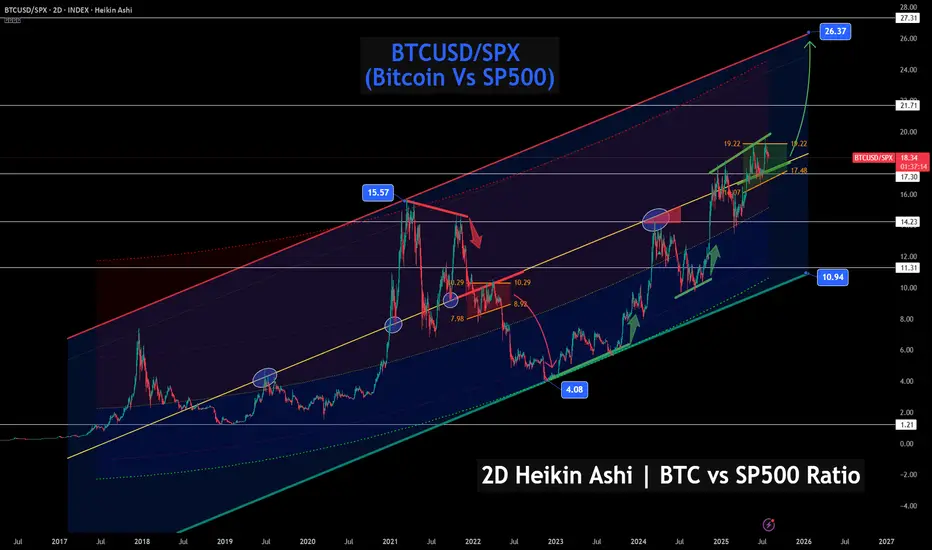
Bitcoin vs S&P 500 – Ratio Signals Strength, Chart favors BTC!🚀📊 Bitcoin vs S&P 500 – Ratio Signals Strength, Even If Stocks Correct 🔍📈
After posting earlier today about VOO (S&P 500 ETF) and the index itself hitting major resistance, I wanted to shift our focus to what could shine even if stocks pull back: Bitcoin.
This chart shows the BTCUSD/SPX ratio –
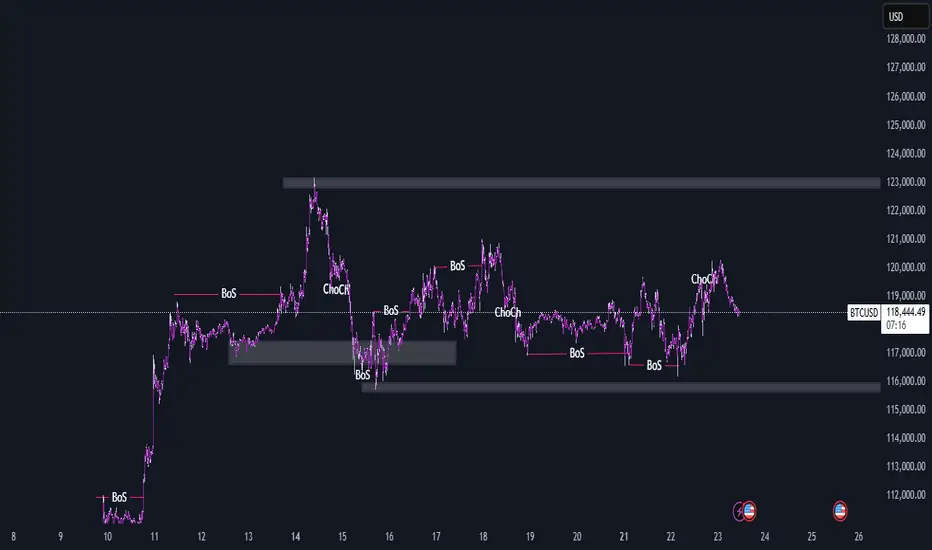
BTCUSD 15M SMC AnalysisThis is my analysis on the BTCUSD pair. It looks like it's going short. I'm looking out for a bearish candle during the New York Session to take the trade. Not financial advise, just an idea. Corrections are welcome.
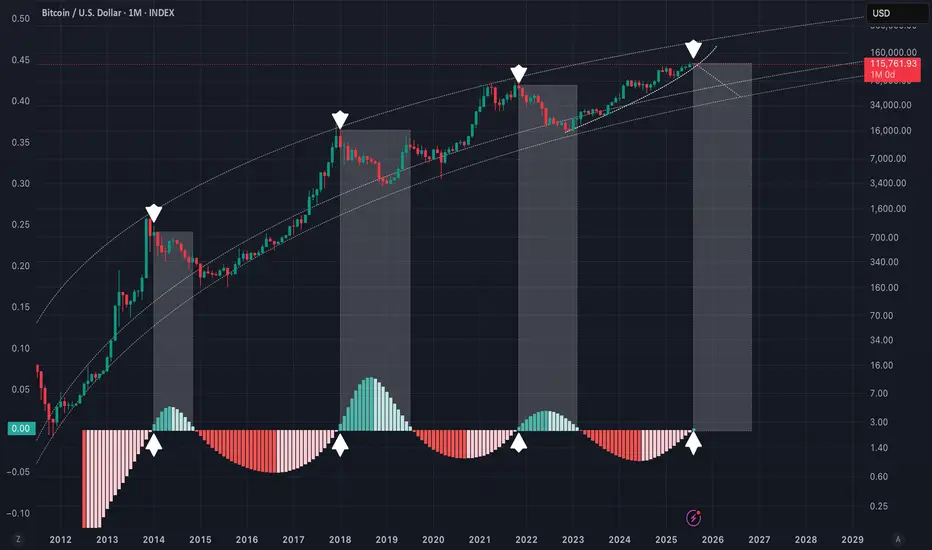
We might be changing the trend in the coming months!I found this indicator extremely accurate for the past tops. We are focusing on the histogram today and looking once that green candles starts growing momentum taking BTC down the hill. If this idea proves right we might be bottoming around 400 days perhaps August 2026 ~45k
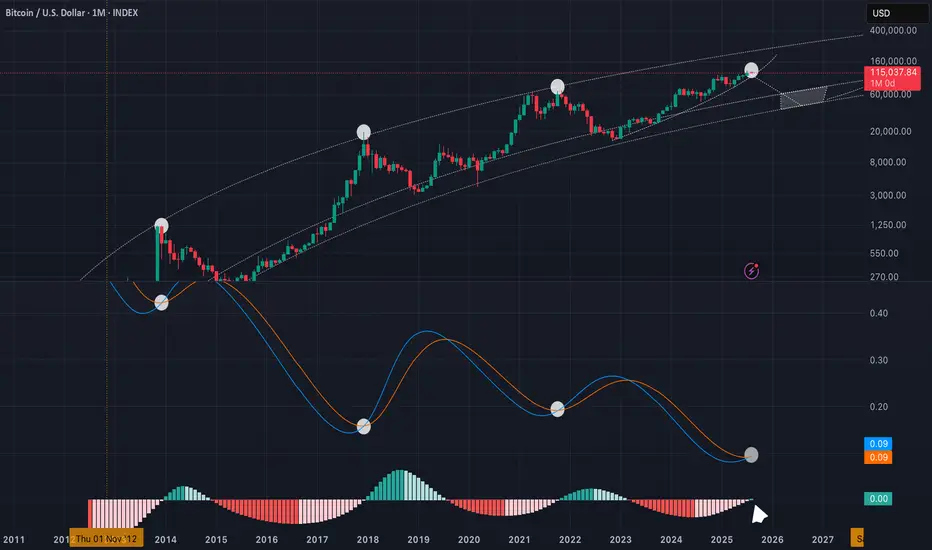
Get out now! Bullmarket might be over This is LMACD applied to GC with reduced lag. If this time is not different we just had our cycle top ~123k. Sell some coins and buy back around 2026 ~44K
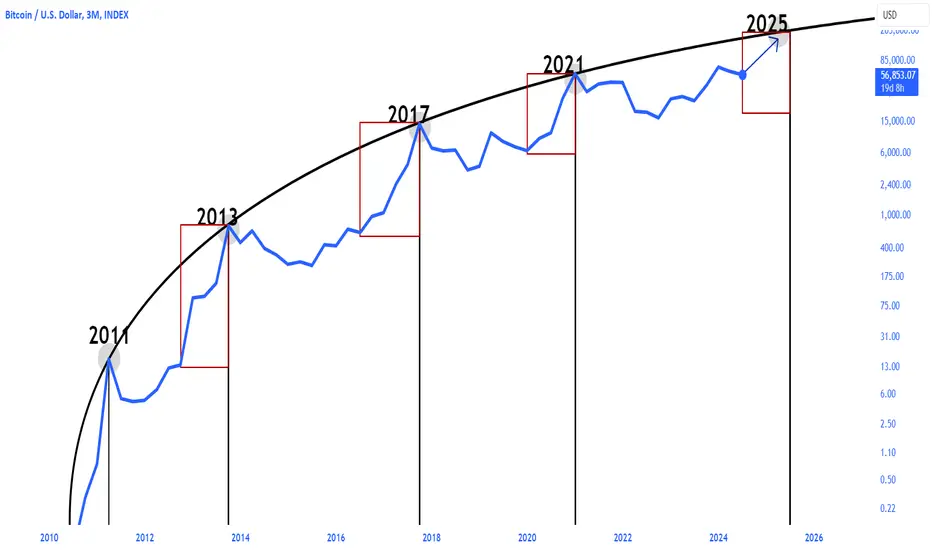
#Bitcoin is in the early stages of its mega bull run!#btc follows past cycles steadily
focus on the big picture
See all ideas
Displays a symbol's price movements over previous years to identify recurring trends.