It's beyond doubt now that Bitcoin (BTCUSD) has started the new Parabolic Rally (PR), technically the most aggressive phase of the Bull Cycle. We've made numerous analyses in the past explaining on time why we expected this break-out to take place after 7 months of accumulation.
What we bring to you today is the SPX/RUT ratio, the correlation of the S&P500 (SPX) and Russell 2000 (RUT) indices against BTC and how it confirms that this rally will now accelerate to a pace that it won't be easy to get caught (i.e. bought).
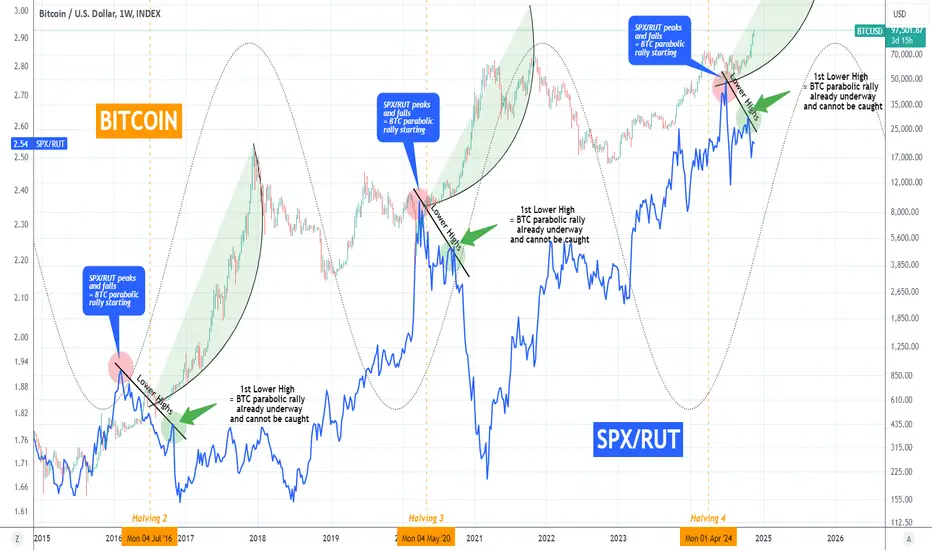
The SPX/RUT ratio is displayed by the blue trend-line. The ratio is particularly helpful during Bitcoin's Parabolic Rally phase as their correlation is mostly a negative one, meaning when the ratio falls, Bitcoin rises. On this chart, this correlation is present on a cyclical basis. This means that during every Cycle, it displays a behavioral pattern that is common.
The key characteristic here is the Lower Highs pattern that the ratio forms every Cycle around the Halving time. As you can see, when SPX/RUT peaks (red circle) and starts forming Lower Highs, Bitcoin stars its Parabolic Rally (green arc). On the 1st Lower High, BTC's rally is already underway and has entered the stage where due to the sheer buying pressure and aggression, getting an entry is difficult. The Lower Highs on SPX/RUT also signify a shift from big capitalization stocks to low, i.e. an increasing appetite for riskier assets and that transcends to the Bitcoin market as well.
So what do you think? Does the SPX/RUT ratio indicate that we've started the part of BTC's rally that is hard to catch? Feel free to let us know in the comments section below!
-------------------------------------------------------------------------------
** Please LIKE 👍, FOLLOW ✅, SHARE 🙌 and COMMENT ✍ if you enjoy this idea! Also share your ideas and charts in the comments section below! This is best way to keep it relevant, support us, keep the content here free and allow the idea to reach as many people as possible. **
-------------------------------------------------------------------------------
💸💸💸💸💸💸
👇 👇 👇 👇 👇 👇
What we bring to you today is the SPX/RUT ratio, the correlation of the S&P500 (SPX) and Russell 2000 (RUT) indices against BTC and how it confirms that this rally will now accelerate to a pace that it won't be easy to get caught (i.e. bought).
The SPX/RUT ratio is displayed by the blue trend-line. The ratio is particularly helpful during Bitcoin's Parabolic Rally phase as their correlation is mostly a negative one, meaning when the ratio falls, Bitcoin rises. On this chart, this correlation is present on a cyclical basis. This means that during every Cycle, it displays a behavioral pattern that is common.
The key characteristic here is the Lower Highs pattern that the ratio forms every Cycle around the Halving time. As you can see, when SPX/RUT peaks (red circle) and starts forming Lower Highs, Bitcoin stars its Parabolic Rally (green arc). On the 1st Lower High, BTC's rally is already underway and has entered the stage where due to the sheer buying pressure and aggression, getting an entry is difficult. The Lower Highs on SPX/RUT also signify a shift from big capitalization stocks to low, i.e. an increasing appetite for riskier assets and that transcends to the Bitcoin market as well.
So what do you think? Does the SPX/RUT ratio indicate that we've started the part of BTC's rally that is hard to catch? Feel free to let us know in the comments section below!
-------------------------------------------------------------------------------
** Please LIKE 👍, FOLLOW ✅, SHARE 🙌 and COMMENT ✍ if you enjoy this idea! Also share your ideas and charts in the comments section below! This is best way to keep it relevant, support us, keep the content here free and allow the idea to reach as many people as possible. **
-------------------------------------------------------------------------------
💸💸💸💸💸💸
👇 👇 👇 👇 👇 👇
👑Best Signals (Forex/Crypto+70% accuracy) & Account Management (+20% profit/month on 10k accounts)
💰Free Channel t.me/tradingshotglobal
🤵Contact info@tradingshot.com t.me/tradingshot
🔥New service: next X100 crypto GEMS!
💰Free Channel t.me/tradingshotglobal
🤵Contact info@tradingshot.com t.me/tradingshot
🔥New service: next X100 crypto GEMS!
Disclaimer
The information and publications are not meant to be, and do not constitute, financial, investment, trading, or other types of advice or recommendations supplied or endorsed by TradingView. Read more in the Terms of Use.