***This is only a historical comparison and today can be different****.
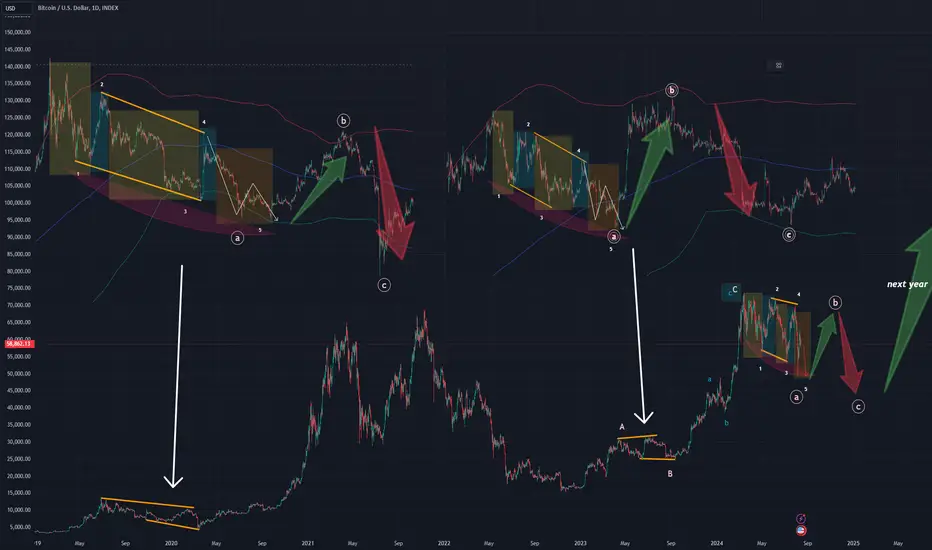
I found two movements in the history which are 1-5(A) and then rise point B and fall again point C and then START A NEW BIG RALLY.
And point b(PUMP) will come soon, maybe early September? or late august? I don't know, it's all just a guess.
****Only a surprising similarity that can change!**** MD
I found two movements in the history which are 1-5(A) and then rise point B and fall again point C and then START A NEW BIG RALLY.
And point b(PUMP) will come soon, maybe early September? or late august? I don't know, it's all just a guess.
****Only a surprising similarity that can change!**** MD
Note
Since tw moves my marks when I publish the analysis, here is a better chartNote
macd is very similar and the feel of the bb and blue line is also similarNote
I made a percentage comparison and with each wave separately and got a result of about 50% increase (point b), which could be today if this assumption holds water. we'll soon see what actually happensNote
Note
heatmap shows many closed trades(liquidation) when btc reaches yellow.Note
in many cases the heatmap follows the liquidations, but this is not the ruleNote
If this is true and follows the pattern that was in the previous two btc will fall 48k. and pumps 70k+.expected pump start early September.
Don't forget this is all just a guess
Note
in four days a new 10d candle will be opened, if we believe that we are in this situation then the red 10d candle will be closed here.will 28 Aug/7 Sep close in the red on the 10d chart? I don't know but we'll see what happens
Trade active
It seems that this supposed point b has already started. in october btc can be more expensive than current price with this theory. 74k higher is real considering rsi but 100k this year is not. with this theory novem and december are bloodshed.Note
point b of **volume** abc*Note
it seems that it is ready, but is it really?In about 20 days, the basic(macd) indicators will be ready.
the previous four times rsi7 was always red.
just a guess from the indicators.
btc going down next 20 days? maybe
Trade active
two completely separate analyzes and detected waves are similar. it already creates logicdoge:
Disclaimer
The information and publications are not meant to be, and do not constitute, financial, investment, trading, or other types of advice or recommendations supplied or endorsed by TradingView. Read more in the Terms of Use.
Disclaimer
The information and publications are not meant to be, and do not constitute, financial, investment, trading, or other types of advice or recommendations supplied or endorsed by TradingView. Read more in the Terms of Use.