🚀 BTCUSD: Decoding the Price Action Through "Tape Reading" 🚀
Hey Traders,
Let's dive into a "tape reading" analysis of BTCUSD, breaking down the recent price movements and looking ahead. We've seen some fascinating patterns emerge, and understanding them could be key to our next moves.
🔍 A Look Back: The Bullish Flag Formations 🔍
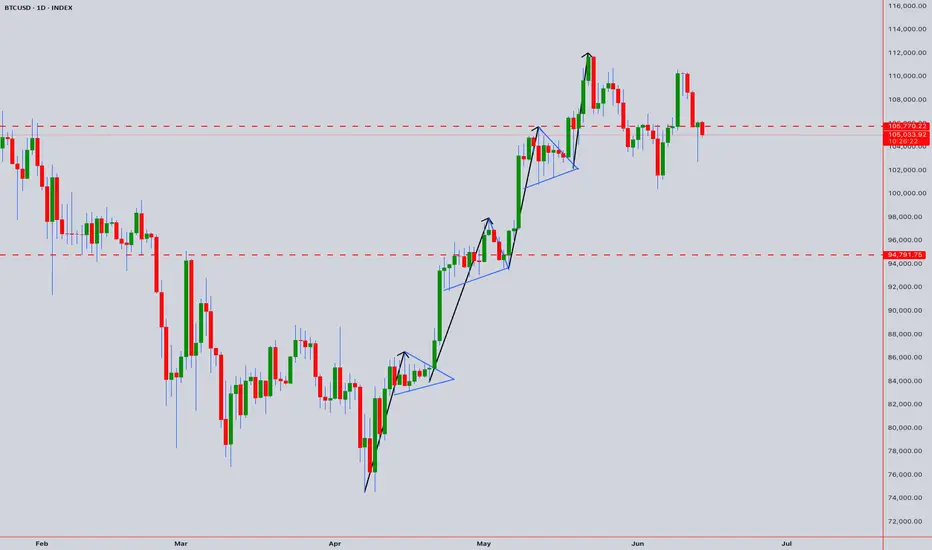
Our journey begins on April 7th, 2025, with the establishment of a strong "Flag Pole" at $74,489.00. This was supported by a robust double bottom, setting the stage for what was to come.
First "Flag" Confirmation: We saw the first "Flag" form, confirmed by a powerful "Hammer" candle on April 20th, 2025. This Hammer, with its unique "bottom-less Marubozu" body, signaled significant underlying strength.
Second "Flag" Confirmation: Another "Flag" emerged, solidified by strong multi-day bottom support around $94,791.00. This resilience suggested continued upward momentum.
The Breakout: On May 8th, 2025, BTCUSD surged, breaking out of its previous patterns and entering a new "flag pole" formation.
Third "Flag" & All-Time High: May 15th, 2025, brought the third "Flag" formation, again supported by a "Hammer" and a bullish Marubozu. This momentum culminated in a breach of the $105,770.00 multi-month price level on May 20th, 2025, breaking the previous all-time high from December 17th, 2024! We then rocketed to a new all-time high of $112,000.
📉 Recent Developments: The Downtrend and Key Levels 📉
Since the all-time high, we've started to experience a shift:
Downtrend Begins: A downtrend initiated around May 22nd, 2025.
High-Low Formations: We observed a second high-low formation on May 27th, 2025, followed by another on June 9th, 2025.
Double Top & Hanging Man: A clear double top formation emerged, further supported by a "Hanging Man" candle on June 10th, 2025.
🔮 What's Next? The Critical Close 🔮
Today's candle close is absolutely paramount! As of now, the candle is still forming, but my current read suggests a potential move to fill the wick of the June 13th, 2025, "Hammer" candle.
The direction BTCUSD takes – North or South – will largely be dictated by how today's candle closes. This will be our prime dominant signal.
Monthly Candle Perspective:
Interestingly, the Monthly candle is showing similar "Flag" patterns. Check out the chart here for a broader perspective:
Let me know your thoughts in the comments below! Are you seeing the same patterns?
Trade safe!
_________________________________________________________________________________
⚠️ Disclaimer: This post is educational content and does not constitute investment advice, financial advice, or trading recommendations. The views expressed here are based on technical analysis and are shared solely for informational purposes. The stock market is subject to risks, including capital loss, and readers should exercise due diligence before investing. We do not take responsibility for decisions made based on this content. Consult a certified financial advisor for personalized guidance.
Hey Traders,
Let's dive into a "tape reading" analysis of BTCUSD, breaking down the recent price movements and looking ahead. We've seen some fascinating patterns emerge, and understanding them could be key to our next moves.
🔍 A Look Back: The Bullish Flag Formations 🔍
Our journey begins on April 7th, 2025, with the establishment of a strong "Flag Pole" at $74,489.00. This was supported by a robust double bottom, setting the stage for what was to come.
First "Flag" Confirmation: We saw the first "Flag" form, confirmed by a powerful "Hammer" candle on April 20th, 2025. This Hammer, with its unique "bottom-less Marubozu" body, signaled significant underlying strength.
Second "Flag" Confirmation: Another "Flag" emerged, solidified by strong multi-day bottom support around $94,791.00. This resilience suggested continued upward momentum.
The Breakout: On May 8th, 2025, BTCUSD surged, breaking out of its previous patterns and entering a new "flag pole" formation.
Third "Flag" & All-Time High: May 15th, 2025, brought the third "Flag" formation, again supported by a "Hammer" and a bullish Marubozu. This momentum culminated in a breach of the $105,770.00 multi-month price level on May 20th, 2025, breaking the previous all-time high from December 17th, 2024! We then rocketed to a new all-time high of $112,000.
📉 Recent Developments: The Downtrend and Key Levels 📉
Since the all-time high, we've started to experience a shift:
Downtrend Begins: A downtrend initiated around May 22nd, 2025.
High-Low Formations: We observed a second high-low formation on May 27th, 2025, followed by another on June 9th, 2025.
Double Top & Hanging Man: A clear double top formation emerged, further supported by a "Hanging Man" candle on June 10th, 2025.
🔮 What's Next? The Critical Close 🔮
Today's candle close is absolutely paramount! As of now, the candle is still forming, but my current read suggests a potential move to fill the wick of the June 13th, 2025, "Hammer" candle.
The direction BTCUSD takes – North or South – will largely be dictated by how today's candle closes. This will be our prime dominant signal.
Monthly Candle Perspective:
Interestingly, the Monthly candle is showing similar "Flag" patterns. Check out the chart here for a broader perspective:
Let me know your thoughts in the comments below! Are you seeing the same patterns?
Trade safe!
_________________________________________________________________________________
⚠️ Disclaimer: This post is educational content and does not constitute investment advice, financial advice, or trading recommendations. The views expressed here are based on technical analysis and are shared solely for informational purposes. The stock market is subject to risks, including capital loss, and readers should exercise due diligence before investing. We do not take responsibility for decisions made based on this content. Consult a certified financial advisor for personalized guidance.
Related publications
Disclaimer
The information and publications are not meant to be, and do not constitute, financial, investment, trading, or other types of advice or recommendations supplied or endorsed by TradingView. Read more in the Terms of Use.
Related publications
Disclaimer
The information and publications are not meant to be, and do not constitute, financial, investment, trading, or other types of advice or recommendations supplied or endorsed by TradingView. Read more in the Terms of Use.