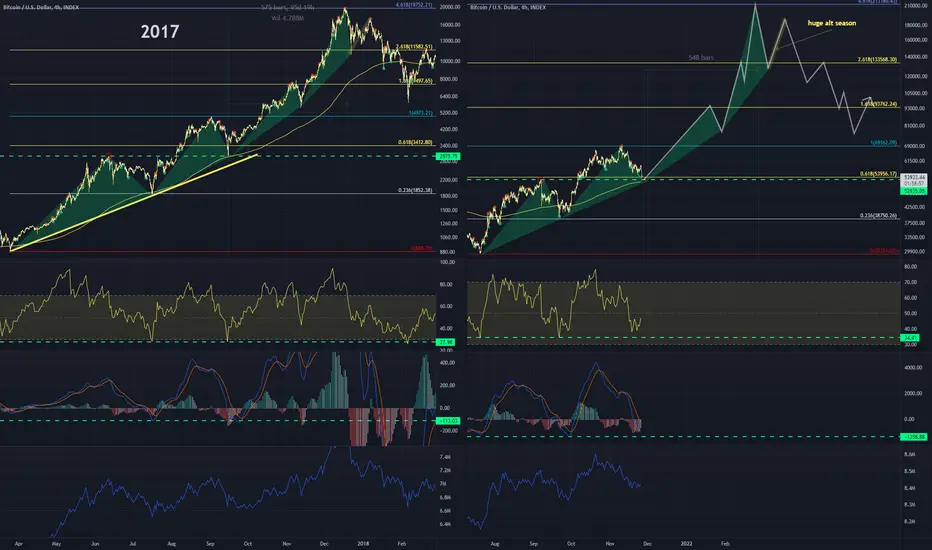
2017's price action bounced off its June peak. Are we going to bounce off the August peak? We're sitting on five similar characteristics :(1) diagonal trendline, (2) 0.618 fib level, & (3) 53k massive support level, (4) August peak, & (5) 150D EMA.
Timing was looking similar as well until November didn't perform as anticipated even those establishing a new high.
So, if history is any indication, we're looking at a lengthened cycle that'd extend into Feb-April of next year (so far).
I'm still bullish on reaching 200k+, but if we break 50k as a low here, using 2017's price action to predict our current cycle top may dissolve. Thus, I doubt we'll see below 50k at the moment... but as always, NO ONE KNOWS. So gamble responsibly :)
Related publications
Disclaimer
The information and publications are not meant to be, and do not constitute, financial, investment, trading, or other types of advice or recommendations supplied or endorsed by TradingView. Read more in the Terms of Use.
Related publications
Disclaimer
The information and publications are not meant to be, and do not constitute, financial, investment, trading, or other types of advice or recommendations supplied or endorsed by TradingView. Read more in the Terms of Use.