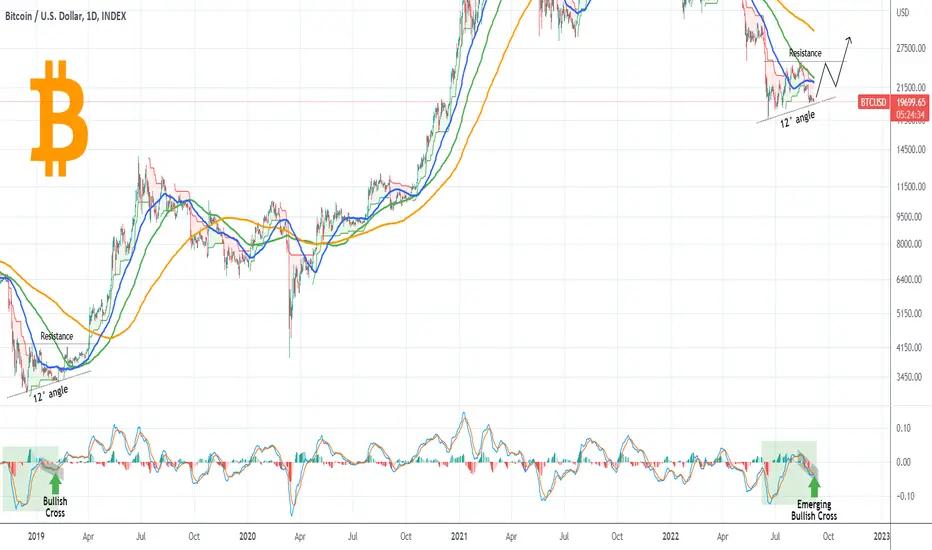
Bitcoin (BTCUSD) is about to form a Bullish Cross on the MACD (1D time-frame) as it trades below both the 1D MA50 (blue trend-line) and the 1D MA100 (green trend-line). The last time it did a similar formation on those levels while Bitcoin was recovering from a market low was on February 07 2019, during the December 2018 - March 2019 Cycle Bottom formation.
What followed was an instant price rebound which around 10 days it broke above both the 1D MA50 and 1D MA100 and a little after 2 weeks it tested the Bottom Fractal's Resistance. Once BTC broke above that Resistance it instantly broke above the 1D MA200 (orange trend-line) also and the Q2 2019 rally, the first of the previous Bull Cycle was already well underway.
At the moment it appears that we are exactly on that kick-start point, supported on the 12° angle Higher Lows trend-line, with the Supertrend indicator flashing red. Do you think that this emerging MACD Bullish Cross, can repeat the post February 2019 sequence? Feel free to share your work and let me know in the comments section below!
--------------------------------------------------------------------------------------------------------
Please like, subscribe and share your ideas and charts with the community!
--------------------------------------------------------------------------------------------------------
👑Best Signals (Forex/Crypto+70% accuracy) & Account Management (+20% profit/month on 10k accounts)
💰Free Channel t.me/tradingshotglobal
🤵Contact info@tradingshot.com t.me/tradingshot
🔥New service: next X100 crypto GEMS!
💰Free Channel t.me/tradingshotglobal
🤵Contact info@tradingshot.com t.me/tradingshot
🔥New service: next X100 crypto GEMS!
Disclaimer
The information and publications are not meant to be, and do not constitute, financial, investment, trading, or other types of advice or recommendations supplied or endorsed by TradingView. Read more in the Terms of Use.