📈 BTC/USD
🕒 Interval: 4H
1. General trend
We are observing a medium-term downtrend.
Since June 10 (middle vertical line), the price has been systematically creating lower highs and lower lows.
Current price: approx. USD 102.625.
2. Formation and Price Action
🔻 Left side of the chart (May 20 - June 10):
Volatility, no clear direction, but local highs are formed in the area of USD 111,000 - 112,500.
Consolidation from May 27 to June 2.
🔻 Right side of the chart (after June 10):
A clear breakout from the consolidation downwards.
A potential correction or continuation of the downward movement is currently forming.
The last candles suggest a strong downward impulse, and the current candle has a long lower shadow – a possible demand reaction.
3. Technical levels
📉 Resistance:
$112,400 – local peak from June 10.
$109,000 – $109,500 – area of previous consolidations.
$107,000 – lower limit of previous support.
📈 Support:
$102,000 – currently tested level.
$100,000 – psychological support level.
$97,000 – potential range of further declines.
4. Stochastic RSI (oscillator at the bottom of the chart)
The indicator currently shows the intersection of the %K and %D lines in the oversold zone.
This may suggest a short-term upward rebound – but in the context of a downtrend, this may just be a correction.
5. Candles and price action
The last candle has a long lower shadow and a close close to the maximum – this may indicate buyer pressure in this zone.
No confirmation of a reversal – only the closing of a bullish candle and a breakout above USD 103,500–104,000 may give a signal of a larger rebound.
6. Scenarios
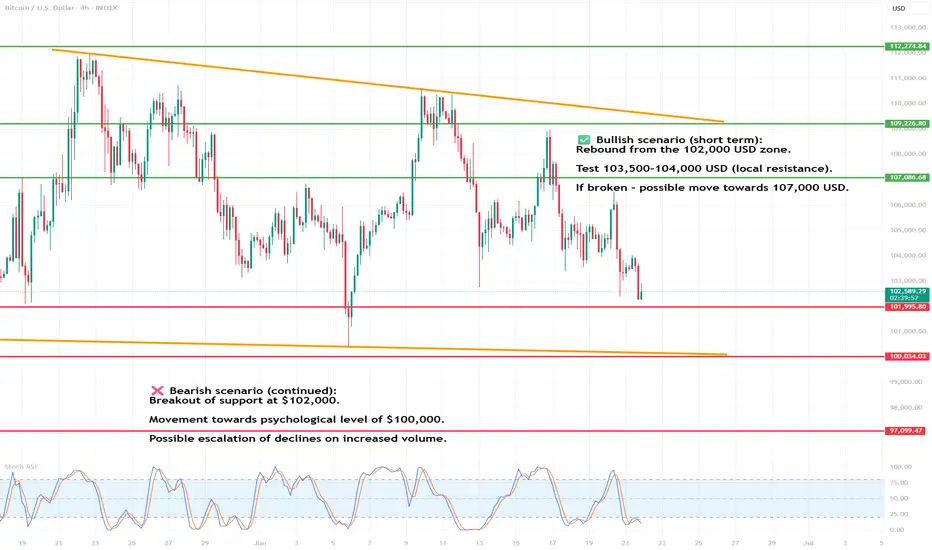
✅ Bullish scenario (short-term):
Rebound from the USD 102,000 zone.
Test of USD 103,500–104,000 (local resistance).
If broken – a move towards USD 107,000 is possible.
❌ Bearish scenario (continuation):
Breakout of support at USD 102,000.
Movement towards the psychological level of 100,000 USD.
Possible escalation of declines on increased volume.
7. Signals to watch
Price behavior in the area of 102k USD - a key place to react.
Volume indicators (not visible here) could confirm the direction of the movement.
Will stochastic RSI give a full buy signal? (%K line above %D, both coming out of the oversold zone).
🕒 Interval: 4H
1. General trend
We are observing a medium-term downtrend.
Since June 10 (middle vertical line), the price has been systematically creating lower highs and lower lows.
Current price: approx. USD 102.625.
2. Formation and Price Action
🔻 Left side of the chart (May 20 - June 10):
Volatility, no clear direction, but local highs are formed in the area of USD 111,000 - 112,500.
Consolidation from May 27 to June 2.
🔻 Right side of the chart (after June 10):
A clear breakout from the consolidation downwards.
A potential correction or continuation of the downward movement is currently forming.
The last candles suggest a strong downward impulse, and the current candle has a long lower shadow – a possible demand reaction.
3. Technical levels
📉 Resistance:
$112,400 – local peak from June 10.
$109,000 – $109,500 – area of previous consolidations.
$107,000 – lower limit of previous support.
📈 Support:
$102,000 – currently tested level.
$100,000 – psychological support level.
$97,000 – potential range of further declines.
4. Stochastic RSI (oscillator at the bottom of the chart)
The indicator currently shows the intersection of the %K and %D lines in the oversold zone.
This may suggest a short-term upward rebound – but in the context of a downtrend, this may just be a correction.
5. Candles and price action
The last candle has a long lower shadow and a close close to the maximum – this may indicate buyer pressure in this zone.
No confirmation of a reversal – only the closing of a bullish candle and a breakout above USD 103,500–104,000 may give a signal of a larger rebound.
6. Scenarios
✅ Bullish scenario (short-term):
Rebound from the USD 102,000 zone.
Test of USD 103,500–104,000 (local resistance).
If broken – a move towards USD 107,000 is possible.
❌ Bearish scenario (continuation):
Breakout of support at USD 102,000.
Movement towards the psychological level of 100,000 USD.
Possible escalation of declines on increased volume.
7. Signals to watch
Price behavior in the area of 102k USD - a key place to react.
Volume indicators (not visible here) could confirm the direction of the movement.
Will stochastic RSI give a full buy signal? (%K line above %D, both coming out of the oversold zone).
Disclaimer
The information and publications are not meant to be, and do not constitute, financial, investment, trading, or other types of advice or recommendations supplied or endorsed by TradingView. Read more in the Terms of Use.
Disclaimer
The information and publications are not meant to be, and do not constitute, financial, investment, trading, or other types of advice or recommendations supplied or endorsed by TradingView. Read more in the Terms of Use.