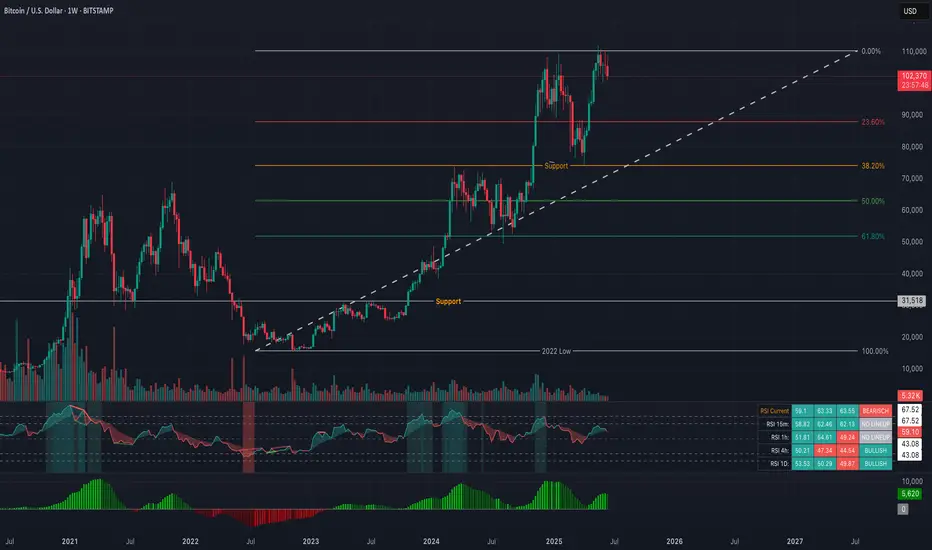
BTCUSD trend shows multiple bearish indications.
- Monthly RSI bearish divergence. This is the 3rd monthly bearish divergence in the entire BTC history. The previous one was the ATH before the 2022 recession. BTC price dropped 70% in 2022.
- Weekly RSI downtrend.
- Weekly MACD downtrend.
- Weekly bearish momentum red candles and downtrend wicks.
If the history repeats itself and BTC drops 70% like in 2022, it will find its final support around 31,500, but we don't know for sure yet. Before that, a few key levels of support needs to be penetrated. 75,000 is a major support we need to watch for.
Disclaimer
The information and publications are not meant to be, and do not constitute, financial, investment, trading, or other types of advice or recommendations supplied or endorsed by TradingView. Read more in the Terms of Use.
Disclaimer
The information and publications are not meant to be, and do not constitute, financial, investment, trading, or other types of advice or recommendations supplied or endorsed by TradingView. Read more in the Terms of Use.