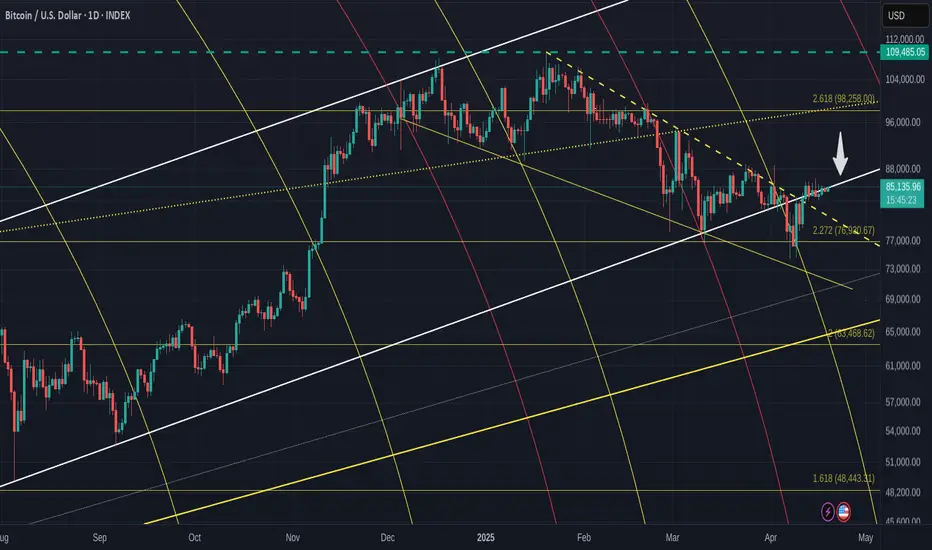
On this chart, the Bold While rising lines are the upper and Lower Trendlines of the Ascending channel
The Blue Dashed line is tha current ATH line
PA finally reached the Lower trend line having spent Months in a controlled descent from the ATH in January. PA attempted to rise over the Local line of resistance ( dashed white line) on a number of occasions but was defeated.
This is probably duwe to the Bulls as that Fib circle we were heading towards was possibly Strong and they wanted to wait until we had the support of the Lower rising Trend line.
And, as you can see, we still got defeated when that Fib circle Met the rising line of support and PA Fell below..But thankfully, we had that 2.272 Fib extension to bounce off.
The battle we now have, is trying to reclaim that rising line as Support. ( Arrow)
And for Days now, we have attempted , Failed, reattempted.
The BEARS are determined.
However, Bitcoin Bulls have the advantage here.
The 4 hour shows more detail
https://tradingview.sweetlogin.com/x/DegLFg5S/
This weekend offers the best chance of reclaiming this line as support.
PA has the strength of a Neutral MACD on the weekly, a Strong RSI and turning Sentment
LETS GO
Nothing to be taken as Financial advice.
I will always say
"Only invest what you can afford to loose. When you are ready, take out your original investment. This way, it is only your profit that is at risk"
THAT is Financial advice
I will always say
"Only invest what you can afford to loose. When you are ready, take out your original investment. This way, it is only your profit that is at risk"
THAT is Financial advice
Disclaimer
The information and publications are not meant to be, and do not constitute, financial, investment, trading, or other types of advice or recommendations supplied or endorsed by TradingView. Read more in the Terms of Use.