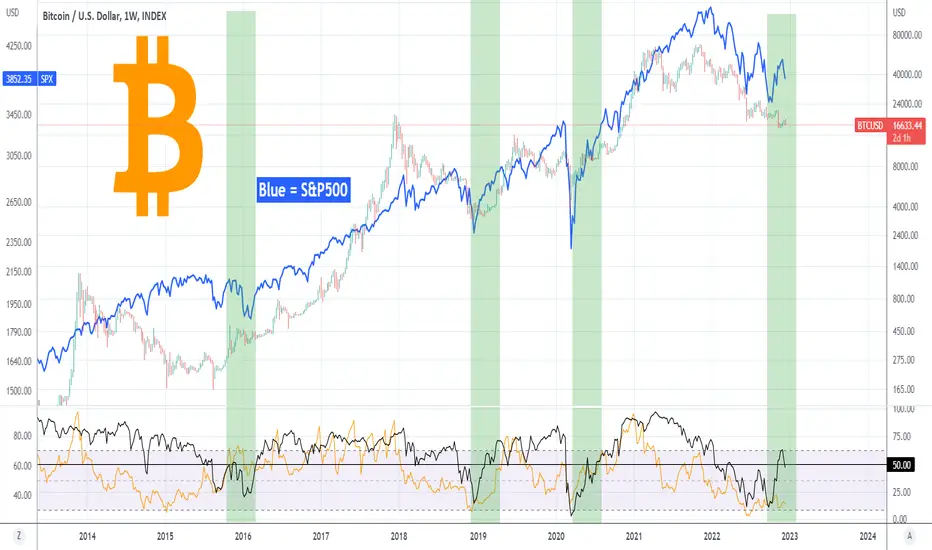
This is Bitcoin (BTCUSD) on the 1W time-frame compared to the S&P500 index (SPX) illustrated by the blue trend-line. The indicator below (black trend-line) shows that historically when 50% of the S&P500 stocks break above their 1D MA200, both Bitcoin and the S&P500 start a rally soon.
Initially a few weeks of volatility takes place but the process already kicks in. Bitcoin's RSI is displayed in orange to give a better perspective of where we could be historically compared to prior bottoms. As you see, it tends to lag behind the stocks' indicator when it breaks above 50% .
Do you think the pattern will be repeated again? Feel free to let me know in the comments section below!
-------------------------------------------------------------------------------
** Please LIKE 👍, SUBSCRIBE ✅, SHARE 🙌 and COMMENT ✍ if you enjoy this idea! Also share your ideas and charts in the comments section below! This is best way to keep it relevant, support me, keep the content here free and allow the idea to reach as many people as possible. **
-------------------------------------------------------------------------------
You may also TELL ME 🙋♀️🙋♂️ in the comments section which symbol you want me to analyze next and on which time-frame. The one with the most posts will be published tomorrow! 👏🎁
-------------------------------------------------------------------------------
💸💸💸💸💸💸
👇 👇 👇 👇 👇 👇
👑Best Signals (Forex/Crypto+70% accuracy) & Account Management (+20% profit/month on 10k accounts)
💰Free Channel t.me/tradingshotglobal
🤵Contact info@tradingshot.com t.me/tradingshot
🔥New service: next X100 crypto GEMS!
💰Free Channel t.me/tradingshotglobal
🤵Contact info@tradingshot.com t.me/tradingshot
🔥New service: next X100 crypto GEMS!
Disclaimer
The information and publications are not meant to be, and do not constitute, financial, investment, trading, or other types of advice or recommendations supplied or endorsed by TradingView. Read more in the Terms of Use.