On chart:
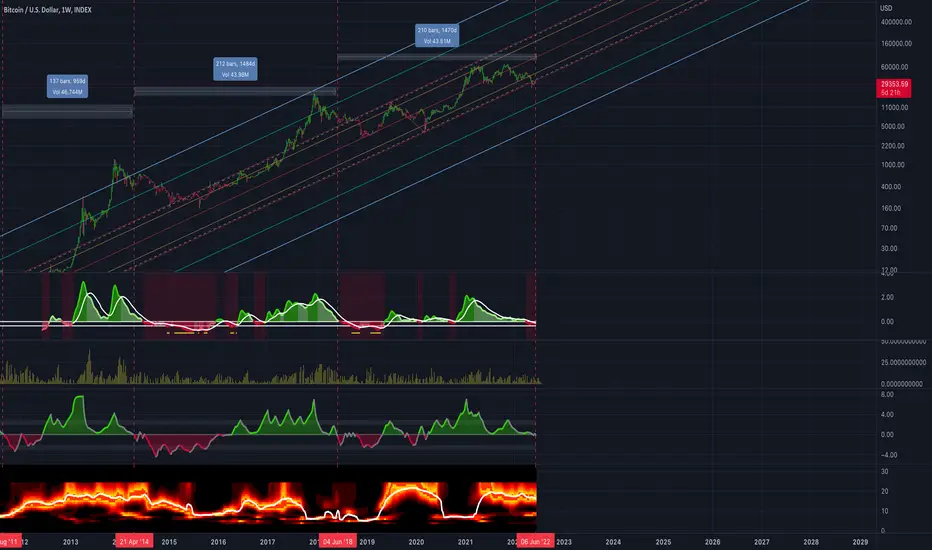
Cycle Adaptive Volatility Meter: Autocorrelation Dominant Cycle Adaptive Volatility by TRD (True Range Double) to correct for volatility skew
GARCH: Projected Standard deviation %, 6 week forward projection
Fisher Cycle Adaptive, Fisher Transform: Mean Reversion
Autocorrelation Periodogram: Measure of cycle dominance with price-to-cycle fitness, current cycle length = 16 weeks
Volatility is dumping, mean of price already 2 weeks inside danger zone, last week was small relief, standard deviation % forward projection pointed downward
Conclusion: Perilous times ahead, only positive here is that price is sitting on bottom of Pitch Fork in Log at 99.7% stop which could mean we whipsaw back to the mean; however, lots of confluence pointing to further down from here--matching past full bear-to-bull. Bear-to-bull cycles used to attempt to capture when BTC bottom is in to ride next cycle bottom to next cycle top. Assuming our GARCH projection holds, and we continue downward, we might get some action here with a standard deviation squeeze
Note
Bear case: We follow past cycles into the abyss, this time breaking the 11-year log trendBull case: We pump off SD squeeze and 99.7% band from last impulse from bear cycle and maintain 11 year log trend
Public Telegram Group, t.me/algxtrading_public
VIP Membership Info: patreon.com/algxtrading/membership
VIP Membership Info: patreon.com/algxtrading/membership
Disclaimer
The information and publications are not meant to be, and do not constitute, financial, investment, trading, or other types of advice or recommendations supplied or endorsed by TradingView. Read more in the Terms of Use.