__________________________________________________________________________________
Technical Overview – Summary Points
__________________________________________________________________________________
__________________________________________________________________________________
Strategic Summary
__________________________________________________________________________________
__________________________________________________________________________________
Multi-Timeframe Analysis
__________________________________________________________________________________
__________________________________________________________________________________
Strategic Bias – Pro Summary
__________________________________________________________________________________
__________________________________________________________________________________
Technical Overview – Summary Points
__________________________________________________________________________________
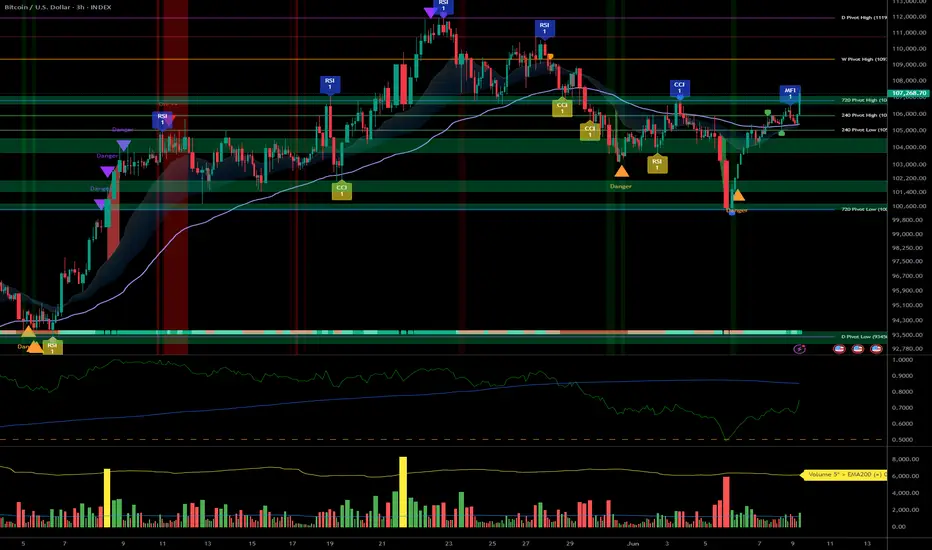
- Momentum: Strong bullish momentum across higher timeframes. Generalized “Up” alignment via MTFTI, strong leverage from the Risk On / Risk Off Indicator (Strong Buy on all timeframes except temporary 2H Down).
- Supports / Resistances: Price evolving just below major resistances (107643.9, 109952.8, 111949) and holding above key defensive zones (104940/105287.8, then 100353/100335).
- Volumes: Average on higher timeframes, very high/accelerating on 30min/15min (potential buying climax or local volatility spike).
- Multi-TF/ISPD DIV Behaviour: ISPD mostly neutral, but “Sell” warning on 30min during volume peaks (risk of quick profit-taking or fake breakout).
__________________________________________________________________________________
Strategic Summary
__________________________________________________________________________________
- Global Bias: Ultra-bullish. Momentum structure supported by technical/sectoral/on-chain convergence.
- Opportunity: Buy on defended pullbacks (support 104940/105287.8) or daily confirmation > 107700. Extension toward 109950–111949 upon pivot breakouts.
- Main Risk: Extreme volumes + ISPD Sell alerts (30min) = caution, speculative excess/whipsaw possible, quick profit-taking, lack of macro catalyst (weekend proximity).
- Macro Catalysts: No urgent catalysts (macro stable, low exogenous risk).
- Action Plan:
- Tactical entry on defended pullbacks or validated daily signal > 107700.
- Stop-loss below 104940 (pivot), swing validation below 100335/100353 (on-chain).
- Active management of 107600–107700 zone (potential climax/local capitulation).
- Tactical entry on defended pullbacks or validated daily signal > 107700.
__________________________________________________________________________________
Multi-Timeframe Analysis
__________________________________________________________________________________
- 1D (Daily): Strong momentum, price just below pivots, no sell signal. Supports: 100300/93337.4.
- 12H: Similar structure, buyers in control, potential dip under 107600–109900.
- 6H/4H: Ongoing bullish impulse, test of the critical 107640–107644; no signs of weakness bar minor consolidation.
- 2H: Only TF Down, technical breakout underway, “Up” signal restoring (watch for fakeout below 107600).
- 1H: Strong Up momentum, breakout confirmed, next candle confirmation needed.
- 30min/15min: Record volumes, ISPD Sell at 30min: high “bull trap” risk. Microsctructure strongly bullish but high post-spike volatility risk.
- Risk On / Risk Off Indicator: Strong Buy on all major timeframes.
Bullish Confluences:
- Up alignment (all majors except 2H), breakouts, confirmed sectoral momentum.
- Very high volumes = new trend or potential buying climax.
Short-term risks:
- ISPD Sell + extreme volume 30min/15min = possible local exhaustion.
- Critical zone: 107600–107700. Watch out for fake breakouts!
__________________________________________________________________________________
Strategic Bias – Pro Summary
__________________________________________________________________________________
- Technical: Setups remain bullish. Pivot breaks “open” the target zone up to 109950–111949. Stops below 104940 (pivot), swing validation sub 100335/100353. Switch to active management on exhaustion signals (vol spike or ISPD Sell).
- On-Chain: Mature distribution; upside limited without new catalyst, but 103700/104940 zone remains pivotal.
- Macro: No bearish macro/news catalyst short-term, technical dominance prevails.
Operational Summary:
- Tactical bullish stance.
- Favor buying dips toward 104940–105287.8.
- Partial profit-taking above 109950.
- Switch defensive on daily break 104940/104000.
__________________________________________________________________________________
Disclaimer
The information and publications are not meant to be, and do not constitute, financial, investment, trading, or other types of advice or recommendations supplied or endorsed by TradingView. Read more in the Terms of Use.
Disclaimer
The information and publications are not meant to be, and do not constitute, financial, investment, trading, or other types of advice or recommendations supplied or endorsed by TradingView. Read more in the Terms of Use.