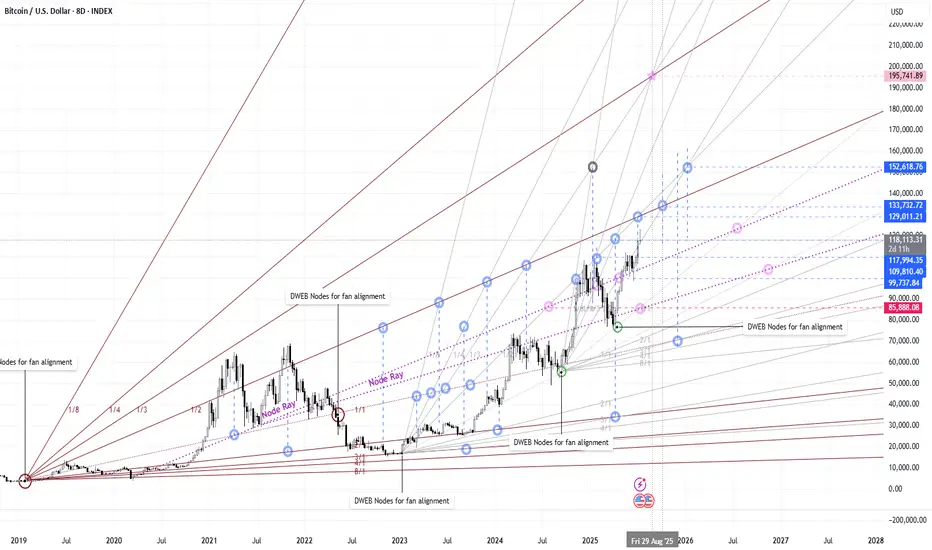
With DWEB indicator , you find the major node trendline built between 2 nodes of the same color ( start with same color). With those nodes and the line given you then have a start point and the alignment for Gann fans and rays. These fans and rays, when properly placed will provide very accurate trends to follow into the future. When using multiple node trends with fans and rays, you will find that when things are aligned properly, the points at which the lines intersect more than likely hold some form of data. This can be in time/pivot zones (x), price levels (y) or both. Take a close look, this chart took all of 20 mins to build and I am willing to bet there is much more data found and drawing tools used to help predict future trends an price action. Sine, Fib, geometry etc. . See the original chart here with DWEB nodes ON. 
Long term I am very bullish on BTC. This is an 8D chart so keep that in mind.
Long term I am very bullish on BTC. This is an 8D chart so keep that in mind.
Disclaimer
The information and publications are not meant to be, and do not constitute, financial, investment, trading, or other types of advice or recommendations supplied or endorsed by TradingView. Read more in the Terms of Use.
Disclaimer
The information and publications are not meant to be, and do not constitute, financial, investment, trading, or other types of advice or recommendations supplied or endorsed by TradingView. Read more in the Terms of Use.