🔍1. Chart Context
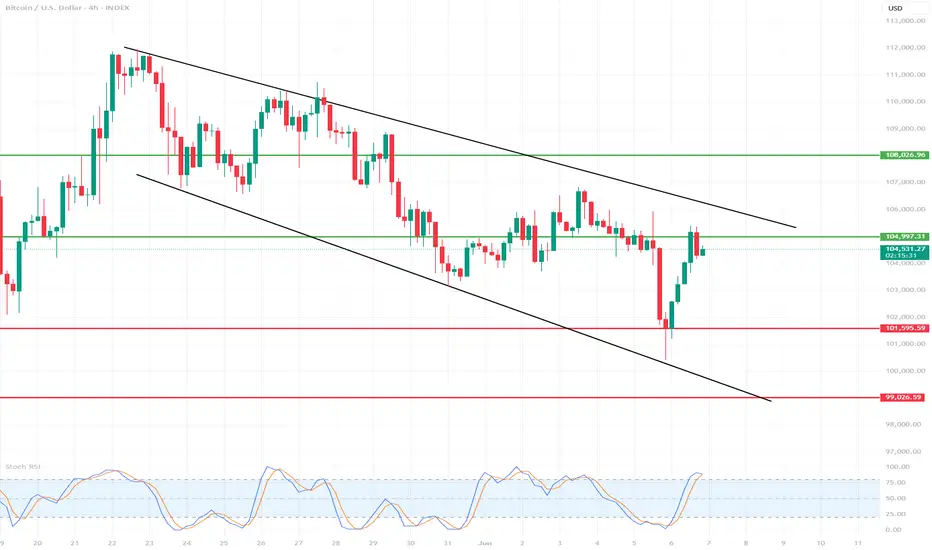
Interval: 4 hours (H4)
Current price: Around 104,950 – 105,400 USD
Range of recent candles: Strong rebound after a decline to around 101,000 USD.
Lower indicator: Stochastic RSI
📊2. Price Action Analysis
Market structure
Main trend (recent days): Downtrend – from the peaks of ~114,000 USD a clear sequence of lower highs and lower lows.
Recent hours: Dynamic decline, followed by a quick, strong rebound from around 101,000 USD to ~105,000 USD.
Key technical levels
✅Resistance:
~105,500–106,000 USD – local peak of the last rebound wave and earlier lows from the end of May.
~108,000 USD – next key level, with a bigger upward movement.
Support:
~102,000–101,000 USD – bottom of the last movement, quick demand reaction, so-called “stop run” or false breakout.
~99,000 USD – psychological zone and important level in case of further declines.
📊3. Indicators
Stochastic RSI (bottom of the chart)
Currently: Stochastic RSI strongly overbought (above 80 points), both lines (blue and orange) are at the top and slightly curling.
Conclusion: Possible short-term correction/slowdown in growth. Overbought Stochastic RSI often precedes pullbacks, especially when testing important resistances.
🧠4. Possible scenarios
Bulls – Upside scenario:
If BTC breaks above $105,500 with momentum, a move to $106,000–108,000 is possible (another resistance and short squeeze).
The key will be the closing of the 4h candle above $105,500.
Bears – Downside scenario:
If the price does not break $105,500, profit taking and a pullback to $103,000–102,000 are possible.
Strong defense of the $101,000–102,000 level by the bulls – if it is broken again, it threatens to deepen the declines even to $99,000.
📊5. Additional Notes
Reduced Volatility: After such a strong bounce, there is often a period of “calmness” and consolidation.
Potential Traps: False breakouts for 4h and sudden changes in direction (characteristic of the crypto market).
📌6. Warning Signals
Stochastic RSI overbought – suggests to be cautious with long positions “on the top” without additional confirmation.
Lack of continuation after a strong bounce – if the price does not “reach” higher in the next candles, the risk of a correction increases.
🧠Summary:
Currently: BTC/USD in a short-term bounce phase after a strong decline. The price is approaching a significant resistance (~105,500 USD). Stochastic RSI shows overbought – possible correction or sideways movement.
Direction for the next few hours: Reactions at USD 105,500 (resistance) and ~USD 102,000 (support) will be key.
Disclaimer
The information and publications are not meant to be, and do not constitute, financial, investment, trading, or other types of advice or recommendations supplied or endorsed by TradingView. Read more in the Terms of Use.
Disclaimer
The information and publications are not meant to be, and do not constitute, financial, investment, trading, or other types of advice or recommendations supplied or endorsed by TradingView. Read more in the Terms of Use.