Today we’ll explore the Bitcoin Terminal Price Risk Indicator, which builds on the concept of Bitcoin Terminal Price. We’ll follow the same logic as in our previous idea on the Pi Cycle Top Risk Indicator. By the end, we'll have a new tool for analyzing  BTCUSD market cycles.
First, let’s recap Terminal Price.
Terminal Price = Transferred Price × 21
Transferred Price = Coin Days Destroyed ÷ (supply × time)
It normalizes historical spending behavior to the full 21M BTC supply. This metric has historically been effective at calling Bitcoin cycle tops whenever the price of Bitcoin crosses above it. That being said, it signaled the April 2021 peak, but not the November one.

Let’s now divide the weekly BTC price by Terminal Price. This gives us BTC-to-Terminal Price Ratio. (We use the formula from the Bitcoin Master Cycle indicator by InvestorUnknown for Terminal Price on TradingView.)
When the ratio crosses above 1, BTC price exceeds Terminal Price and signals cycle top. We can notice that each cycle top forms slightly lower ratio peaks.

Now let’s draw two logarithmic curves through the highs and lows of this ratio, and add a midline.
This creates a band within which the BTC-to-Terminal Price ratio tends to oscillate. These bounds can help anticipate major turning points in future market cycles.

Next, we normalize the ratio between these bounds: bottom curve = 0, top curve = 1.
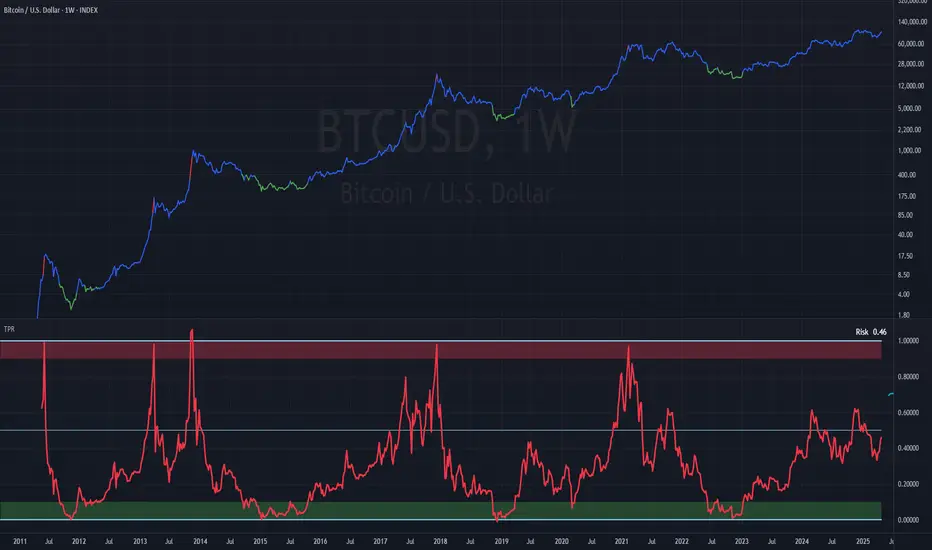
This gives us the Bitcoin Terminal Price Risk Indicator.

Currently, risk sits around 0.46, bouncing between 0.3 and 0.6 for ~1.5 years. This range suggests a stepwise price increase with consolidation periods in between — and no mania and blow-off top.
Historically:
Risk > 0.9 = potential selling zone
Risk < 0.1 (or < 0.05) = potential buying zone
Note: Risk stays > 0.9 for just 1–2 weeks.
Reality check: the top curve lies above 1 and slopes down only slightly.
This implies that if the ratio approaches the upper boundary, BTC price could meet or exceed Terminal Price this cycle — currently ~$155K and will be rising quickly should BTC move towards it.

However, so far we have very few data points and they don’t fit the curve perfectly. And there’s no guarantee we’ll reach that upper bound.
For a more conservative take, we can replace the log curve with straight lines.
This steeper upper line would signal a top earlier — below Terminal Price.

Using this method, risk is slightly higher now at 0.55. While also not perfect, this linear approximation can serve as a cautious alternative until more data points emerge.
We'll keep tracking these charts.
First, let’s recap Terminal Price.
Terminal Price = Transferred Price × 21
Transferred Price = Coin Days Destroyed ÷ (supply × time)
It normalizes historical spending behavior to the full 21M BTC supply. This metric has historically been effective at calling Bitcoin cycle tops whenever the price of Bitcoin crosses above it. That being said, it signaled the April 2021 peak, but not the November one.
Let’s now divide the weekly BTC price by Terminal Price. This gives us BTC-to-Terminal Price Ratio. (We use the formula from the Bitcoin Master Cycle indicator by InvestorUnknown for Terminal Price on TradingView.)
When the ratio crosses above 1, BTC price exceeds Terminal Price and signals cycle top. We can notice that each cycle top forms slightly lower ratio peaks.
Now let’s draw two logarithmic curves through the highs and lows of this ratio, and add a midline.
This creates a band within which the BTC-to-Terminal Price ratio tends to oscillate. These bounds can help anticipate major turning points in future market cycles.
Next, we normalize the ratio between these bounds: bottom curve = 0, top curve = 1.
This gives us the Bitcoin Terminal Price Risk Indicator.
Currently, risk sits around 0.46, bouncing between 0.3 and 0.6 for ~1.5 years. This range suggests a stepwise price increase with consolidation periods in between — and no mania and blow-off top.
Historically:
Risk > 0.9 = potential selling zone
Risk < 0.1 (or < 0.05) = potential buying zone
Note: Risk stays > 0.9 for just 1–2 weeks.
Reality check: the top curve lies above 1 and slopes down only slightly.
This implies that if the ratio approaches the upper boundary, BTC price could meet or exceed Terminal Price this cycle — currently ~$155K and will be rising quickly should BTC move towards it.
However, so far we have very few data points and they don’t fit the curve perfectly. And there’s no guarantee we’ll reach that upper bound.
For a more conservative take, we can replace the log curve with straight lines.
This steeper upper line would signal a top earlier — below Terminal Price.
Using this method, risk is slightly higher now at 0.55. While also not perfect, this linear approximation can serve as a cautious alternative until more data points emerge.
We'll keep tracking these charts.
Related publications
Disclaimer
The information and publications are not meant to be, and do not constitute, financial, investment, trading, or other types of advice or recommendations supplied or endorsed by TradingView. Read more in the Terms of Use.
Related publications
Disclaimer
The information and publications are not meant to be, and do not constitute, financial, investment, trading, or other types of advice or recommendations supplied or endorsed by TradingView. Read more in the Terms of Use.