Following the high interest that my most recent analysis on Bitcoin (BTCUSD) and its Cycles comparison attracted, I decided to make one in the same tone on possible rebound scenarios based on the previous Cycle bottoms.
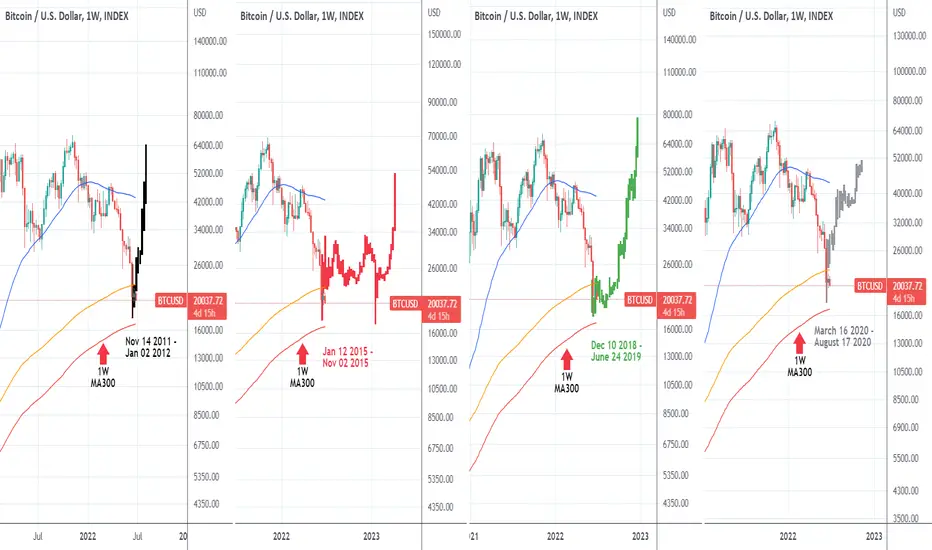
Before I begin, I want to make clear that this work is based on the assumption that the current bottom was priced two weeks ago or at least that it will be formed soon as long as the 1W MA300 (red trend-line) holds. This analysis is on the 1W (weekly) time-frame and I've divided it into four charts, each having a 'bars pattern' fractal of the first rally following a bottom, applied on the current price action.
Apart from the obvious Cycle bottom fractals of Nov 14 2011 - Jan 02 2012 (black bars), Jan 12 2015 - Nov 02 2015 (red bars) and Dec 10 2018 - June 24 2019 (green bars), I've also included the recovery from the COVID crash of March 16 2020 - August 17 2020 (grey bars). Obviously the aggressive and highly volatile nature of the first BTC Cycle (black) projects a sharp recovery of the 1W MA50 (blue trend-line) by August, which under the current macro conditions seems unrealistic. Same goes for the March-Aug 2020 fractal (grey), which also has it by the end of August. The 2015 fractal (red) has this target hit by early April 2023 and is the most pessimistic of all, while the remaining Dec-June 2019 (green) offers a more moderate projection by expecting a 1W MA50 contact by November 2022.
It is interesting to mention though that March-Aug 2020 is the only one that shows rejection and consolidation under the 1W MA50 for 2.5 months before a break higher a scenario that would be realistic too as the 1W MA50 is the initial Resistance of Cycles as they transition from Bear to Bull markets.
Below is an illustration of all fractals on top of each other:

As mentioned above, all these are mere projections based on past data. What matters most now is seeing the 1W MA300 hold and make all weekly candles that follow, close above it in order to maintain buying accumulation. Failure to do so, can make the price test the 13000 level as illustrated on a previous Fibonacci analysis.
So based on the original bottom assumption, which fractal do you feel offers the most realistic projection of a recovery? Or you think the bottom is way past the 1W MA300? Feel free to share your work and let me know in the comments section below!
--------------------------------------------------------------------------------------------------------
Please like, subscribe and share your ideas and charts with the community!
--------------------------------------------------------------------------------------------------------
Before I begin, I want to make clear that this work is based on the assumption that the current bottom was priced two weeks ago or at least that it will be formed soon as long as the 1W MA300 (red trend-line) holds. This analysis is on the 1W (weekly) time-frame and I've divided it into four charts, each having a 'bars pattern' fractal of the first rally following a bottom, applied on the current price action.
Apart from the obvious Cycle bottom fractals of Nov 14 2011 - Jan 02 2012 (black bars), Jan 12 2015 - Nov 02 2015 (red bars) and Dec 10 2018 - June 24 2019 (green bars), I've also included the recovery from the COVID crash of March 16 2020 - August 17 2020 (grey bars). Obviously the aggressive and highly volatile nature of the first BTC Cycle (black) projects a sharp recovery of the 1W MA50 (blue trend-line) by August, which under the current macro conditions seems unrealistic. Same goes for the March-Aug 2020 fractal (grey), which also has it by the end of August. The 2015 fractal (red) has this target hit by early April 2023 and is the most pessimistic of all, while the remaining Dec-June 2019 (green) offers a more moderate projection by expecting a 1W MA50 contact by November 2022.
It is interesting to mention though that March-Aug 2020 is the only one that shows rejection and consolidation under the 1W MA50 for 2.5 months before a break higher a scenario that would be realistic too as the 1W MA50 is the initial Resistance of Cycles as they transition from Bear to Bull markets.
Below is an illustration of all fractals on top of each other:
As mentioned above, all these are mere projections based on past data. What matters most now is seeing the 1W MA300 hold and make all weekly candles that follow, close above it in order to maintain buying accumulation. Failure to do so, can make the price test the 13000 level as illustrated on a previous Fibonacci analysis.
So based on the original bottom assumption, which fractal do you feel offers the most realistic projection of a recovery? Or you think the bottom is way past the 1W MA300? Feel free to share your work and let me know in the comments section below!
--------------------------------------------------------------------------------------------------------
Please like, subscribe and share your ideas and charts with the community!
--------------------------------------------------------------------------------------------------------
👑Best Signals (Forex/Crypto+70% accuracy) & Account Management (+20% profit/month on 10k accounts)
💰Free Channel t.me/tradingshotglobal
🤵Contact info@tradingshot.com t.me/tradingshot
🔥New service: next X100 crypto GEMS!
💰Free Channel t.me/tradingshotglobal
🤵Contact info@tradingshot.com t.me/tradingshot
🔥New service: next X100 crypto GEMS!
Disclaimer
The information and publications are not meant to be, and do not constitute, financial, investment, trading, or other types of advice or recommendations supplied or endorsed by TradingView. Read more in the Terms of Use.