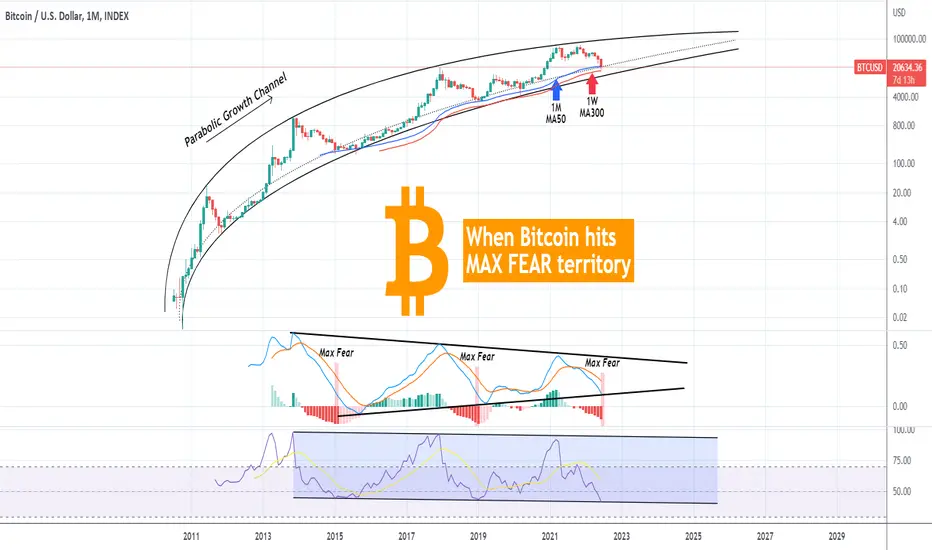
This feels like a 'back to basics' chart for Bitcoin (BTCUSD) as I'm displaying the classic Parabolic Growth Channel but given the amount of negativity in the market, it might be the perfect time to look back into it.
First we all know that the 1W MA200 broke last week and the ultimate MA that supports the Parabola is the 1W MA300 (red trend-line), which is now around 16650. This analysis is on the 1M time-frame though with the 1M MA50 being displayed as the blue trend-line.
** The Parabolic Channel **
As far as the Parabolic Channel is concerned, we can see that since last week the price entered its Growth Zone. That is the territory within the bottom and the dotted line that acted as a Resistance during the Accumulation Phases of 2012, mid 2015 - 2016 and early 2019. As you see on the chart when a monthly (1M) candle enters this Zone, the action has always been a Buy historically.
** The LMACD and RSI **
Perhaps the most interesting aspect on the monthly chart is the LMACD that is about to touch the bottom (Higher Lows trend-line) of the Triangle it has been trading in since the beginning. That is the Triangle that I've coined years ago as the pattern leading to Diminishing Returns and lower volatility. On this month it appears that the LMACD has entered into its 2-month Max Fear territory, which is always before it reverses.
Also the 1M RSI indicator just hit the Lower Lows (bottom) trend-line of the Channel Down it has been trading in since the start. Both previous Lower Lows have coincided with BTC's Cycle Bottoms.
To conclude this, the current monthly candle (June) looks like the capitulation candles of January 2015 and November 2018 that shaped the bottoms of the previous two Bear Cycles. Whether there is some more room left to drop to the 1W MA300 or the June 2019 High (to make contact with the bottom of the Parabolic Channel), by all historic indicators this looks like a favorable Risk/ Reward level to buy for long-term investors.
But what do you think? Do you treat this Max Fear time in the market as a Buy opportunity? Feel free to share your work and let me know in the comments section below!
--------------------------------------------------------------------------------------------------------
Please like, subscribe and share your ideas and charts with the community!
--------------------------------------------------------------------------------------------------------
👑Best Signals (Forex/Crypto+70% accuracy) & Account Management (+20% profit/month on 10k accounts)
💰Free Channel t.me/tradingshotglobal
🤵Contact info@tradingshot.com t.me/tradingshot
🔥New service: next X100 crypto GEMS!
💰Free Channel t.me/tradingshotglobal
🤵Contact info@tradingshot.com t.me/tradingshot
🔥New service: next X100 crypto GEMS!
Disclaimer
The information and publications are not meant to be, and do not constitute, financial, investment, trading, or other types of advice or recommendations supplied or endorsed by TradingView. Read more in the Terms of Use.