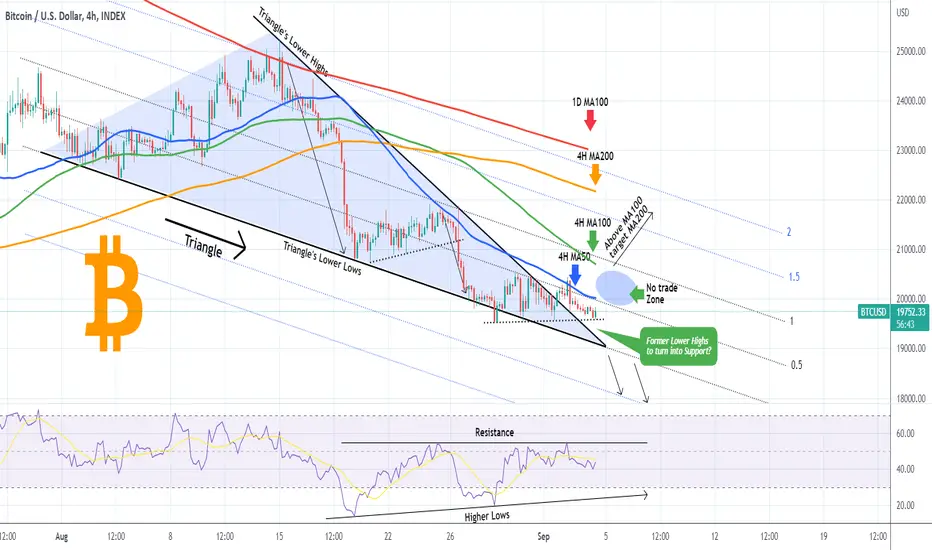
Bitcoin (BTCUSD) broke above the August Triangle but still got rejected on the 4H MA50 (blue trend-line). This leaves us, on the short-term at least, inside neutral ground and it would be best to consider the following break-out set-ups for short-term trading.
Even in the event of a break above the 4H MA50, we still have to consider the important Resistance of the 4H MA100 (green trend-line), which rejected the price on August 18 and practically caused the first important sell-off since June. As a result, we consider the space between the 4H MA50 and the 4H MA100 as a no-trade zone. A break above the 4H MA100, would be a bullish break-out signal, targeting the 4H MA200 (orange trend-line).
On the other hand, a break below the Lower Lows trend-line of the former Triangle, would be a bearish break-out signal targeting the -0.5 Fibonacci extension.
Notice how so far the former Lower Highs of the Triangle stopped the September 02 sell candle and turned the price action sideways on a Higher Lows trend-line (black dots) similar to August 20 - 26. At the same time, the 4H RSI has been supported on Higher Lows but rejected on a horizontal Resistance, forming an Ascending Triangle.
Which short-term set-up do you think is more likely to prevail? Feel free to share your work and let me know in the comments section below!
--------------------------------------------------------------------------------------------------------
Please like, subscribe and share your ideas and charts with the community!
--------------------------------------------------------------------------------------------------------
👑Best Signals (Forex/Crypto+70% accuracy) & Account Management (+20% profit/month on 10k accounts)
💰Free Channel t.me/tradingshotglobal
🤵Contact info@tradingshot.com t.me/tradingshot
🔥New service: next X100 crypto GEMS!
💰Free Channel t.me/tradingshotglobal
🤵Contact info@tradingshot.com t.me/tradingshot
🔥New service: next X100 crypto GEMS!
Disclaimer
The information and publications are not meant to be, and do not constitute, financial, investment, trading, or other types of advice or recommendations supplied or endorsed by TradingView. Read more in the Terms of Use.