Hi All,
These charts are self explanatory.
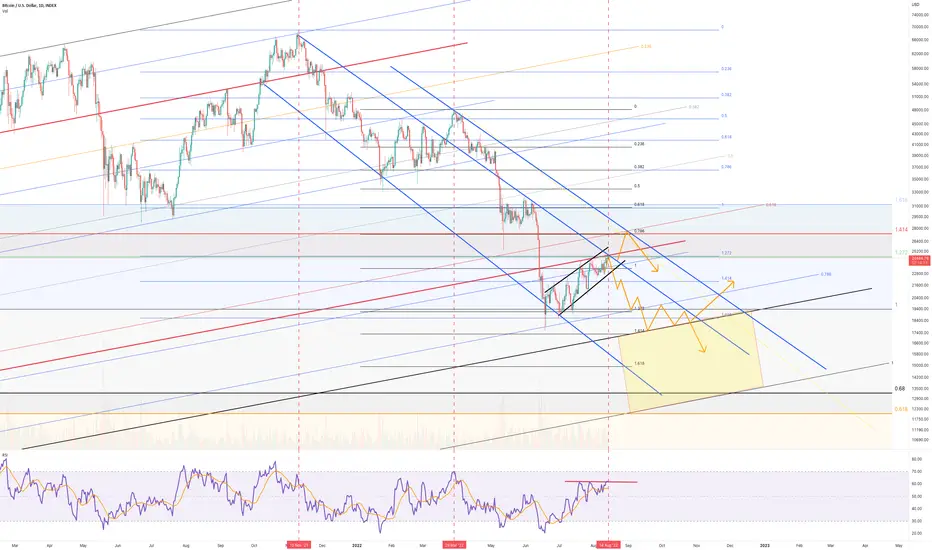
If we break past this resistance (blue) trend line, then we move to the next level as per the fib level and trend lines.
Note: the weekly RSI also is at a critical juncture.
I think it was a missed opportunity to short, and we need to keep an eye on it, as it can play out like the double top from the previous bear flag position.


Please give me a like and share,
All the best,
S.SAri
These charts are self explanatory.
If we break past this resistance (blue) trend line, then we move to the next level as per the fib level and trend lines.
Note: the weekly RSI also is at a critical juncture.
I think it was a missed opportunity to short, and we need to keep an eye on it, as it can play out like the double top from the previous bear flag position.
Please give me a like and share,
All the best,
S.SAri
Trade active
up close, bearish structure is taking shapeNote
chart updateDiscord: discord.com/invite/vb4hbP88vb (TradeToProspa)
Telegram: t.me/TprospaTradersbot
This community has signals now but with no risk management comms.
Telegram: t.me/TprospaTradersbot
This community has signals now but with no risk management comms.
Related publications
Disclaimer
The information and publications are not meant to be, and do not constitute, financial, investment, trading, or other types of advice or recommendations supplied or endorsed by TradingView. Read more in the Terms of Use.
Discord: discord.com/invite/vb4hbP88vb (TradeToProspa)
Telegram: t.me/TprospaTradersbot
This community has signals now but with no risk management comms.
Telegram: t.me/TprospaTradersbot
This community has signals now but with no risk management comms.
Related publications
Disclaimer
The information and publications are not meant to be, and do not constitute, financial, investment, trading, or other types of advice or recommendations supplied or endorsed by TradingView. Read more in the Terms of Use.