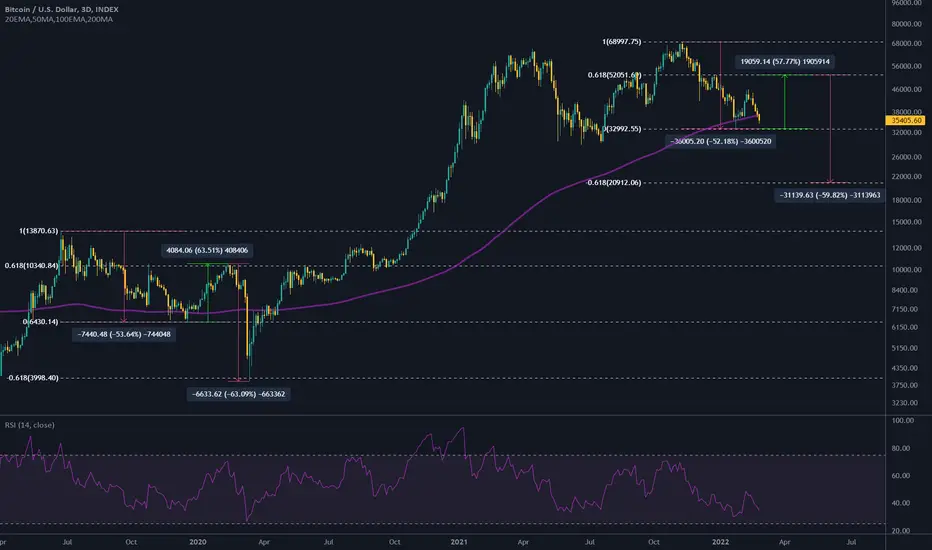
Bitcoin crossed down 200MA (purple) and close below it back in December 2019...
Many sold down there just before the relief rally up to log Fib 0.618, then down to log Fib -0.618 back in March 2020.
If history repeats itself, that would mean 33k -> 52k -> 21k for coming months, prepare for extreme volatility!
Many sold down there just before the relief rally up to log Fib 0.618, then down to log Fib -0.618 back in March 2020.
If history repeats itself, that would mean 33k -> 52k -> 21k for coming months, prepare for extreme volatility!
Trade active
Up to +32.11% since calledBitcoin bounced and regained 200MA so far, pretty accurate bottom catch!
50MA (grey) retest, slightly below 50k, would make much sense to me.
Trade closed: target reached
TP on Fib -0.68Do you guys remember that #Bitcoin chart from February 24th?
Seems like it just went for final target, Fibonacci is not letting us down.
Disclaimer
The information and publications are not meant to be, and do not constitute, financial, investment, trading, or other types of advice or recommendations supplied or endorsed by TradingView. Read more in the Terms of Use.
Disclaimer
The information and publications are not meant to be, and do not constitute, financial, investment, trading, or other types of advice or recommendations supplied or endorsed by TradingView. Read more in the Terms of Use.