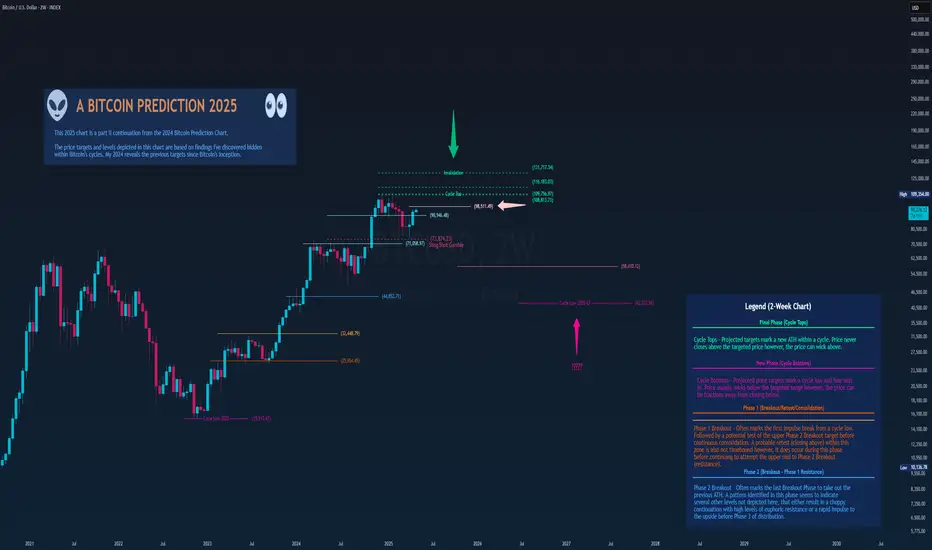
In this chart, we continue the journey of testing whether Bitcoin can live up to the expectations as published in my previous Bitcoin prediction chart (2024). Since we had technically hit my ATH cycle top for 2024–25, we are now gambling with the possibility that we might not have hit the highest cycle top targets and may just extend that little bit more. I think 2025 has most people asking, "Are we done yet?" or are we on the verge of something else? We'll just have to wait and see....
Upside:
As you can see in ATHs, there are several targets, and I've mentioned this in my previous chart. Ultimately, the high side of what this chart can expect from a cycle high is a 2-week close of $131k. Wicks can extend beyond this price, but I expect a close below (according to this chart). A close above will invalidate this chart. All prices within the lows and highs are acceptable.
Downside:
In my previous chart, I hadn't posted any projected targets during a bear market; I only highlighted the lows, as generally that is what most may consider important enough to know—when can we resume the bull market again? Well, in this chart, I have labeled two additional downside targets. Although these do not follow the same pattern as other targets, they do have a significant similarity to previous cycle lows. Expect bounces from these levels, but if the pattern holds true, they will fail and continue to lower prices. In the short term, resistance sits at $98,511, and again this is on a 2-week close. So this next week, we can wick above, which might be the path we are on.
Summary: I'll be posting updates close to each 2 week close, if I see something I'll be sure to post and update.
2024 Chart linked below.
Related publications
Disclaimer
The information and publications are not meant to be, and do not constitute, financial, investment, trading, or other types of advice or recommendations supplied or endorsed by TradingView. Read more in the Terms of Use.
Related publications
Disclaimer
The information and publications are not meant to be, and do not constitute, financial, investment, trading, or other types of advice or recommendations supplied or endorsed by TradingView. Read more in the Terms of Use.