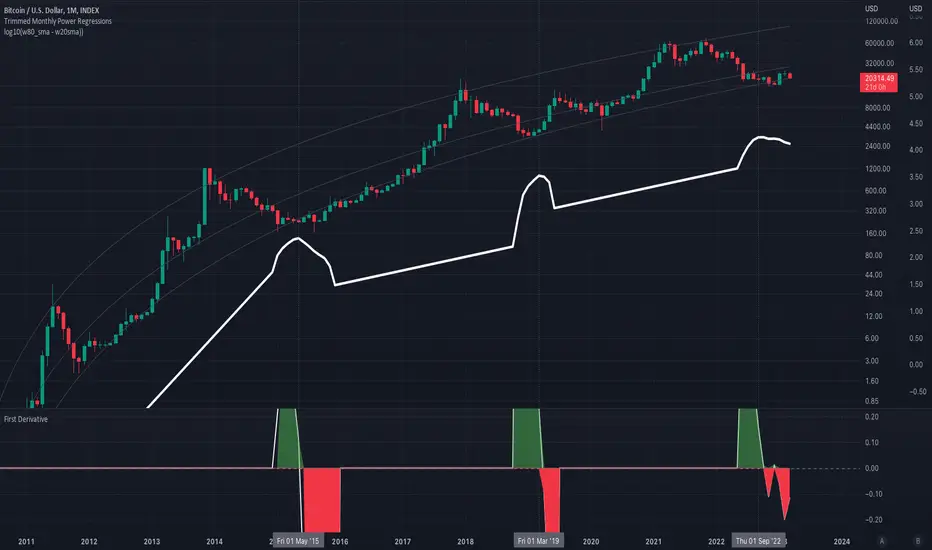
This is the log of the difference between the 80 Week SMA and the 20 Week SMA and its first derivative (slope) on the BTCUSD chart
The white line = [log(80 W SMA - 20 W SMA)] and the red and green waves are the first derivative of said measurement.
This measurement quite clearly indicates that we are moving out of a bear market and into a bull market.
The white line = [log(80 W SMA - 20 W SMA)] and the red and green waves are the first derivative of said measurement.
This measurement quite clearly indicates that we are moving out of a bear market and into a bull market.
Disclaimer
The information and publications are not meant to be, and do not constitute, financial, investment, trading, or other types of advice or recommendations supplied or endorsed by TradingView. Read more in the Terms of Use.
Disclaimer
The information and publications are not meant to be, and do not constitute, financial, investment, trading, or other types of advice or recommendations supplied or endorsed by TradingView. Read more in the Terms of Use.