Hi everyone,
Thank you for considering reading my idea.
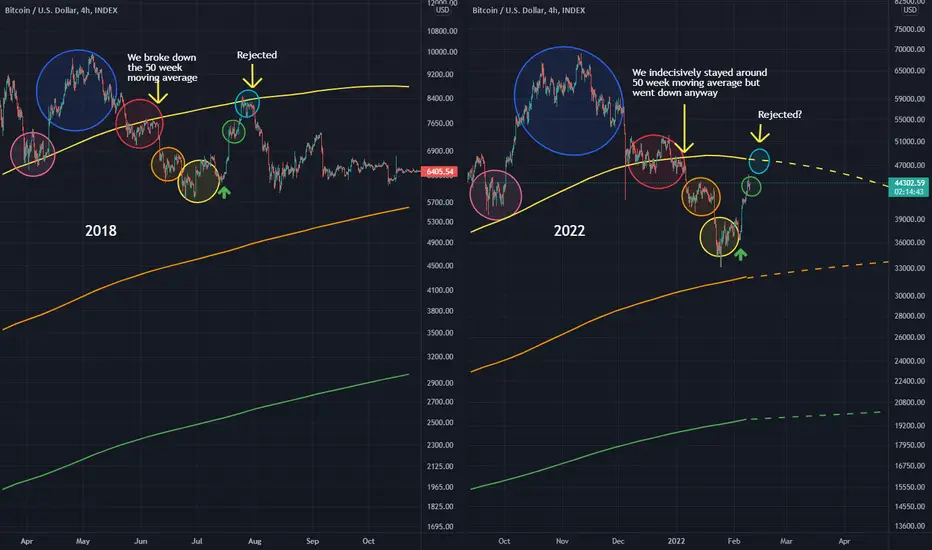
This is the 4 hourly chart of Bitcoin during March 2018-July 2018 and today. Looks like we are currently in the green circle below the 50 week moving average (yellow line). We have been waiting what's going to happen if we reach the 50 week moving average again. See related ideas below why.
Thank you for reading my idea. Like this idea and follow me for more analysis like this. NFA . TAYOR. DYOR.
Cheers,
Juvs
Thank you for considering reading my idea.
This is the 4 hourly chart of Bitcoin during March 2018-July 2018 and today. Looks like we are currently in the green circle below the 50 week moving average (yellow line). We have been waiting what's going to happen if we reach the 50 week moving average again. See related ideas below why.
Thank you for reading my idea. Like this idea and follow me for more analysis like this. NFA . TAYOR. DYOR.
Cheers,
Juvs
Note
See updates here: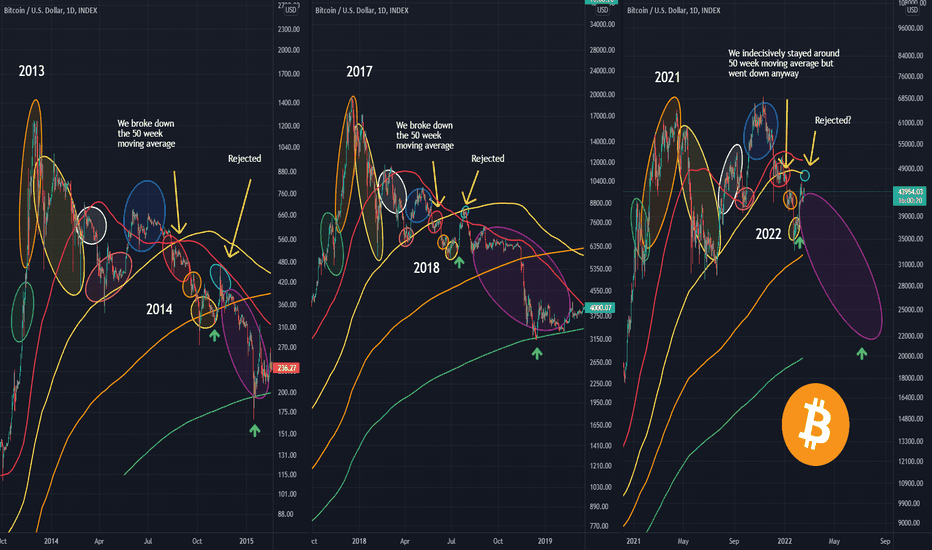
Related publications
Disclaimer
The information and publications are not meant to be, and do not constitute, financial, investment, trading, or other types of advice or recommendations supplied or endorsed by TradingView. Read more in the Terms of Use.
Related publications
Disclaimer
The information and publications are not meant to be, and do not constitute, financial, investment, trading, or other types of advice or recommendations supplied or endorsed by TradingView. Read more in the Terms of Use.