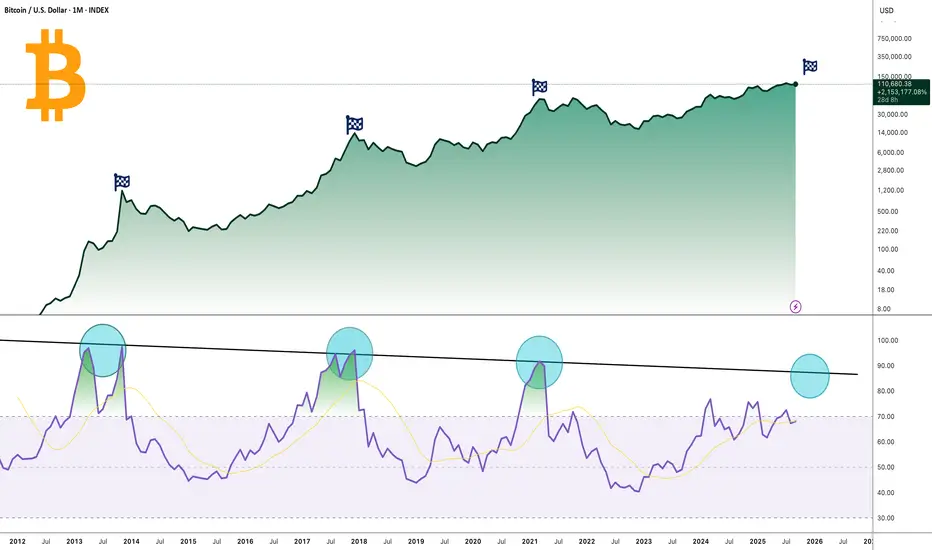
Bitcoin’s long-term price action, alongside the monthly RSI, shows a repeating pattern at major cycle tops. Historically, whenever the RSI reached the descending resistance trendline (Above 85 level) , Bitcoin entered a cycle peak followed by a correction.
Currently, the RSI is once again approaching this key level, raising the question of whether history will repeat or if BTC can finally break through this long-term resistance.
Historical Pattern:
🔷 2013: RSI touched the upper trendline → BTC entered a cycle peak, followed by a deep correction.
🔷 2017: Once again, RSI hit the resistance → marked the bull market top.
🔷 2021: RSI faced rejection at the same line → led to a prolonged bear market.
Now, in 2025–2026, RSI is climbing back toward this resistance level, and the big question remains: Will Bitcoin break the cycle, or repeat history?
Key Points:
🔶 BTC has respected this RSI downtrend at previous market cycle tops (2013, 2017, 2021).
🔶 Price is trading near all-time highs while RSI nears historical resistance.
🔶 A breakout above this RSI trendline could signal a new phase of strength.
🔶 A rejection would suggest another cyclical cooling phase.
Conclusion
Bitcoin is at a macro decision point. For over a decade, this RSI trendline has defined cycle tops. A confirmed breakout would mark a historic shift in BTC’s market structure, while another rejection could mean history repeats.
Cheers
Hexa
BTCUSD  BTCUSDT
  BTCUSDC
Currently, the RSI is once again approaching this key level, raising the question of whether history will repeat or if BTC can finally break through this long-term resistance.
Historical Pattern:
🔷 2013: RSI touched the upper trendline → BTC entered a cycle peak, followed by a deep correction.
🔷 2017: Once again, RSI hit the resistance → marked the bull market top.
🔷 2021: RSI faced rejection at the same line → led to a prolonged bear market.
Now, in 2025–2026, RSI is climbing back toward this resistance level, and the big question remains: Will Bitcoin break the cycle, or repeat history?
Key Points:
🔶
🔶 Price is trading near all-time highs while RSI nears historical resistance.
🔶 A breakout above this RSI trendline could signal a new phase of strength.
🔶 A rejection would suggest another cyclical cooling phase.
Conclusion
Bitcoin is at a macro decision point. For over a decade, this RSI trendline has defined cycle tops. A confirmed breakout would mark a historic shift in BTC’s market structure, while another rejection could mean history repeats.
Cheers
Hexa
🚀Telegram : t.me/hexatrades
🌐Website: hexatrades.io/
🗣️Twitter(X): twitter.com/HexaTrades
🌐Website: hexatrades.io/
🗣️Twitter(X): twitter.com/HexaTrades
Related publications
Disclaimer
The information and publications are not meant to be, and do not constitute, financial, investment, trading, or other types of advice or recommendations supplied or endorsed by TradingView. Read more in the Terms of Use.