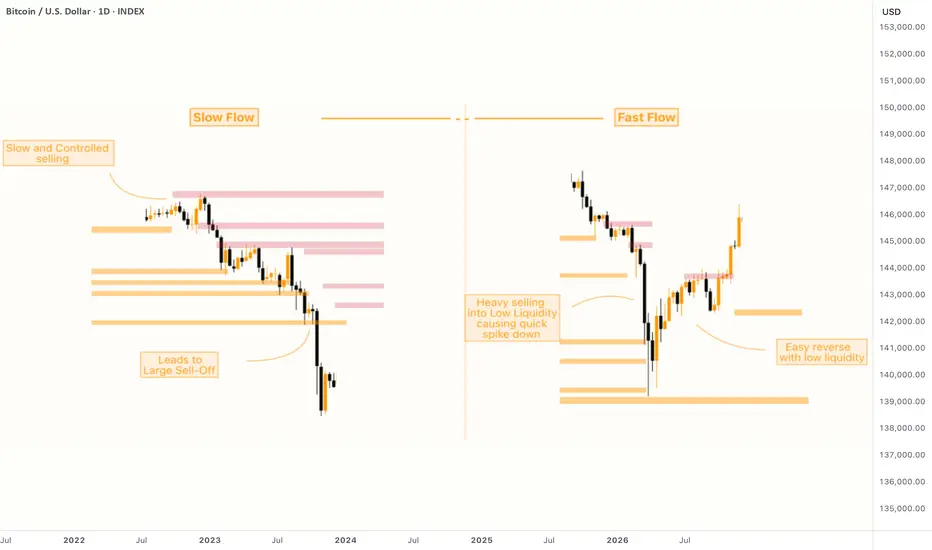
It is always important to look not only at levels (supports/resistances), but how exactly price moves within them.
On the left side, we see a slow flow—a controlled and gradual decline. Sellers are patient, offloading positions over time into visible liquidity levels. Each dip is met with small bids, creating a staircase-like drop. This kind of move doesn’t trigger panic immediately, but it’s dangerous because it builds up pressure. Eventually, when buyers dry up, a larger breakdown happens.
On contrary, the right side shows a fast flow. Here, a large sell order slams into a thin order book, causing an immediate price spike down. There's little resistance, and multiple levels are skipped. This creates an inefficient move, often forming a sharp wick. These fast drops are typically caused by fear, liquidation, or aggressive exit orders. But what’s interesting is the recovery: because the move was so aggressive and liquidity was so thin, price can snap back up quickly. These are often V-shaped reversals with low resistance on the way back.
Try to look for such setups on the chart and learn how the price behaves. Studying such cases will help you identifying upcoming sell-offs/pumps and earn on them.
Klondike Official Links:
Website:
klondikepro.com/
Public Telegram Channel:
t.me/CryptoKlondike
Twitter:
twitter.com/Robert_Klondike
Trade on Bybit with us:
partner.bybit.com/b/6694
Website:
klondikepro.com/
Public Telegram Channel:
t.me/CryptoKlondike
Twitter:
twitter.com/Robert_Klondike
Trade on Bybit with us:
partner.bybit.com/b/6694
Related publications
Disclaimer
The information and publications are not meant to be, and do not constitute, financial, investment, trading, or other types of advice or recommendations supplied or endorsed by TradingView. Read more in the Terms of Use.