After 6 consecutive Green Weeks, Bitcoin maybe about to Turn around and Cool for a bit.
BUT DO NOT PANIC
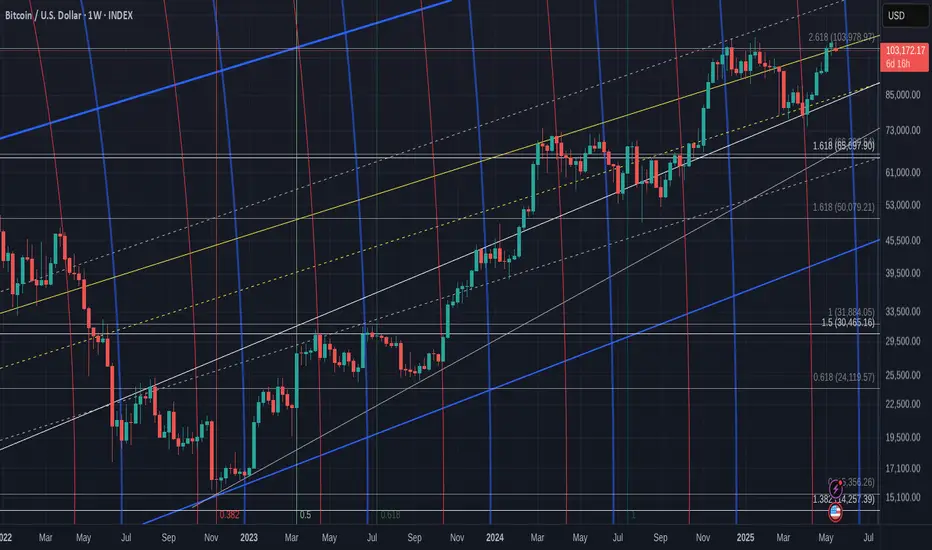
We have opened the week with a sharp drop back below the 2.618 Fib Extension. This in itself is a major move if unsurprising
Last week, we talked about this possibility by looking at the Daily MACD.
https://tradingview.sweetlogin.com/x/CIgcnxWe/
MACD Rising above the Signal line is a Bullish indication and Visa Versa
See the Arrow on the left, how MACD had 2 slight pullbacks and then went higher. This was in Nov 2024, just as the Ranging was finishing and PA was getting ready to push up to its Current ATH line
What I was looking at mostly though, was the Histogram. The Histogram shows us the distance between the MACD line ( yellow ) and its Signal line ( Red ) . The Bigger the bar, the bigger the difference between them.
See how it rose twice and then, went red for 2 days, recovered for a day and then , OFF WE WENT
And I am suggesting this is what may happen again.
So far, that pattern is repeating and the Histogram just went Red.
We may need to understand the difference in scale of this histogram though.
This could point towards a Week of unsettled PA, maybe Longer.
Notice how the MACD ( yellow) has now dropped below the Signal line ( red) as it did in Nov 2024.
During this period of MACD dropping and going red in 2024, we had 6 days of Red PA candles before the Bigger push higher. This may take longer this time but we have to wait and see.
We need to watch this close as the lines of support are in different place now.
If We zoom in on the Weekly PA chart, we see things a little more clearly
https://tradingview.sweetlogin.com/x/9d8bbPgR/
PA has fallen back below a line that was required as support. If you Look back to Nov 2024 area, we can also see a very Big difference in how PA is on the lines of support.
In 2024, we bounced off support.
We are currently being Rejected.
This Daily chart offers some more detail
https://tradingview.sweetlogin.com/x/FuDupN0g/
The Circled area is the Nov 2024 area I been talking about.
Todays pull back is sharper but as we saw with the Histograms, we are in a bigger scale anyway
We could also see a similarity if we look back before the Circled area, see the W shape? A Double Bottom that appeared just before the push up.
Well, we just did that too.......If you back from where we are now, to the Low..There were 2 Dips down and then we pushed higher.
And, again, It is the scale that is Bigger.....
So, for me, this week maybe a bit bloody, but over all, Still Highly BULLISH
We need to regain that 2.618 Fib ext on this chart as support but that may not happen just yet.
There are "Local" lines of support near by and the LOG Daily chart I will post later gives some hope that Big Drops may not happen
The line of resistance just over head is strong and untill we break 112K and Hold it, we are likely to remain being bounced around.
But I do believe we Will do this and that we do seem to be repeating a pattern that led to a Goodpush higher.
We just have to wait and see
BUT DO NOT PANIC
We have opened the week with a sharp drop back below the 2.618 Fib Extension. This in itself is a major move if unsurprising
Last week, we talked about this possibility by looking at the Daily MACD.
https://tradingview.sweetlogin.com/x/CIgcnxWe/
MACD Rising above the Signal line is a Bullish indication and Visa Versa
See the Arrow on the left, how MACD had 2 slight pullbacks and then went higher. This was in Nov 2024, just as the Ranging was finishing and PA was getting ready to push up to its Current ATH line
What I was looking at mostly though, was the Histogram. The Histogram shows us the distance between the MACD line ( yellow ) and its Signal line ( Red ) . The Bigger the bar, the bigger the difference between them.
See how it rose twice and then, went red for 2 days, recovered for a day and then , OFF WE WENT
And I am suggesting this is what may happen again.
So far, that pattern is repeating and the Histogram just went Red.
We may need to understand the difference in scale of this histogram though.
This could point towards a Week of unsettled PA, maybe Longer.
Notice how the MACD ( yellow) has now dropped below the Signal line ( red) as it did in Nov 2024.
During this period of MACD dropping and going red in 2024, we had 6 days of Red PA candles before the Bigger push higher. This may take longer this time but we have to wait and see.
We need to watch this close as the lines of support are in different place now.
If We zoom in on the Weekly PA chart, we see things a little more clearly
https://tradingview.sweetlogin.com/x/9d8bbPgR/
PA has fallen back below a line that was required as support. If you Look back to Nov 2024 area, we can also see a very Big difference in how PA is on the lines of support.
In 2024, we bounced off support.
We are currently being Rejected.
This Daily chart offers some more detail
https://tradingview.sweetlogin.com/x/FuDupN0g/
The Circled area is the Nov 2024 area I been talking about.
Todays pull back is sharper but as we saw with the Histograms, we are in a bigger scale anyway
We could also see a similarity if we look back before the Circled area, see the W shape? A Double Bottom that appeared just before the push up.
Well, we just did that too.......If you back from where we are now, to the Low..There were 2 Dips down and then we pushed higher.
And, again, It is the scale that is Bigger.....
So, for me, this week maybe a bit bloody, but over all, Still Highly BULLISH
We need to regain that 2.618 Fib ext on this chart as support but that may not happen just yet.
There are "Local" lines of support near by and the LOG Daily chart I will post later gives some hope that Big Drops may not happen
The line of resistance just over head is strong and untill we break 112K and Hold it, we are likely to remain being bounced around.
But I do believe we Will do this and that we do seem to be repeating a pattern that led to a Goodpush higher.
We just have to wait and see
Disclaimer
The information and publications are not meant to be, and do not constitute, financial, investment, trading, or other types of advice or recommendations supplied or endorsed by TradingView. Read more in the Terms of Use.
Disclaimer
The information and publications are not meant to be, and do not constitute, financial, investment, trading, or other types of advice or recommendations supplied or endorsed by TradingView. Read more in the Terms of Use.