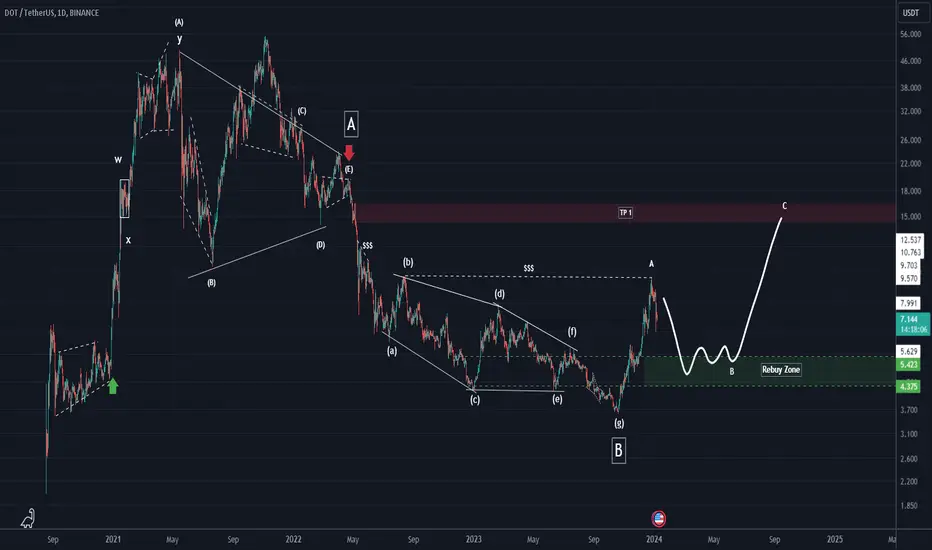
The large wave B of the DOT symbol is over and we are now in an ascending C wave
Wave a consists of C and now we seem to see a correction for wave b of C The green range is the rebuy zone, which consists of two FLIP lines
Closing a weekly candle below the green range will violate the analysis
For risk management, please don't forget stop loss and capital management
Comment if you have any questions
Thank You
🔆To succeed in trading, just enter our Telegram channel:
Free membership: t.me/Behdark_EN
🔷Our Telegram channel has daily spot and futures signals 👉 t.me/Behdark_EN
💎 Exclusive signals are only shared on our Telegram channel
Free membership: t.me/Behdark_EN
🔷Our Telegram channel has daily spot and futures signals 👉 t.me/Behdark_EN
💎 Exclusive signals are only shared on our Telegram channel
Disclaimer
The information and publications are not meant to be, and do not constitute, financial, investment, trading, or other types of advice or recommendations supplied or endorsed by TradingView. Read more in the Terms of Use.