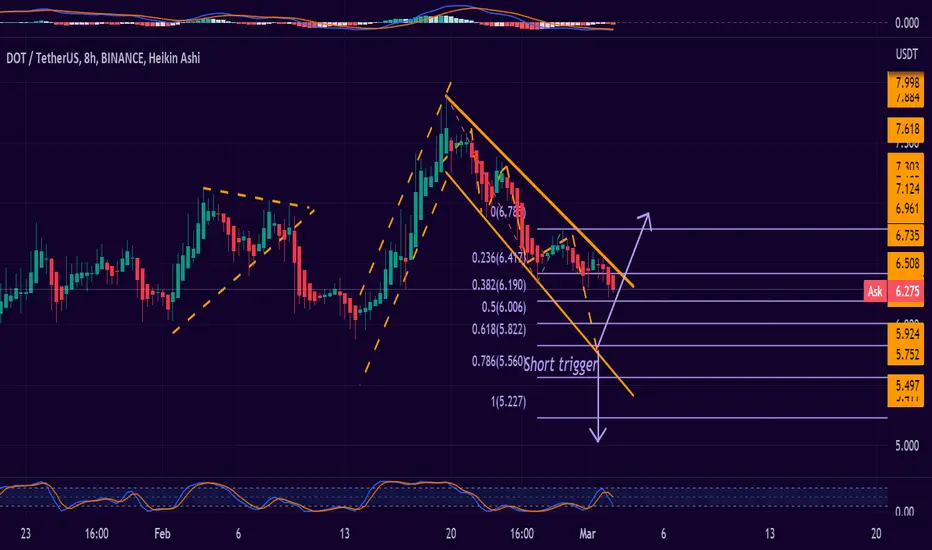
DOTUSDT 8H
The DOT USDT chart in an 8-hour period continues to indicate the bearish channel. It could break the upward channel and leave this bearish trend, but if it drops from the level of 5,833 then we will have a SHORT TRIGGER, that is a trigger for the shorts.
On the M45 chart, we will see the supports and resistances:
DOTUSDT M45:
S1:6,215
S2: 6,145
R1: 6,331
R2: 6,356
Disclaimer
The information and publications are not meant to be, and do not constitute, financial, investment, trading, or other types of advice or recommendations supplied or endorsed by TradingView. Read more in the Terms of Use.
Disclaimer
The information and publications are not meant to be, and do not constitute, financial, investment, trading, or other types of advice or recommendations supplied or endorsed by TradingView. Read more in the Terms of Use.
