hi Traders,
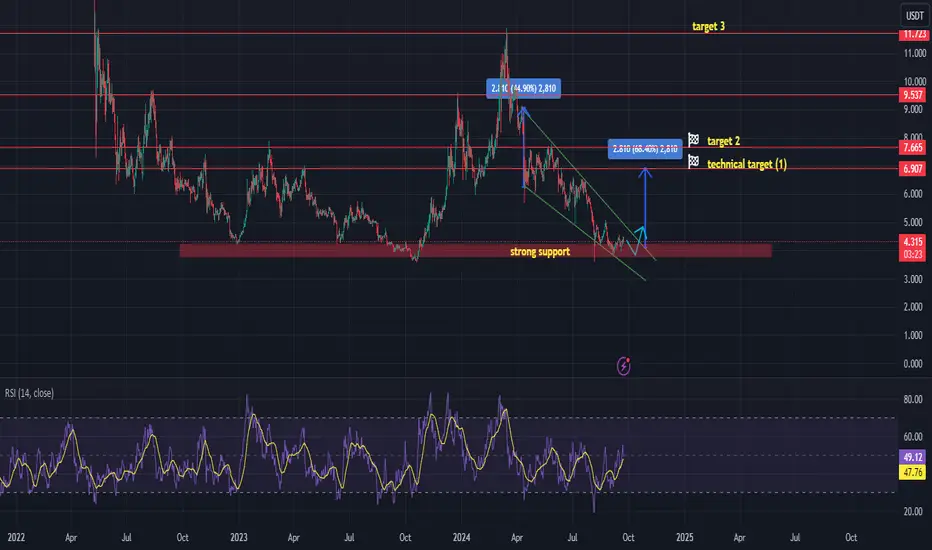
We're analyzing the DOTUSDT Daily chart, and the price is now at $4.30 and has formed a falling wedge
formation.
If the price breaks out of the falling wedge , entering the long position will be justified.
The technical target for this move is around $6.90.
3 more targets are shown on the chart
The RSI is currently at 49 , which is still in the neutral zone, but it’s forming higher lows, indicating
growing bullish momentum. This is often a sign that buying pressure is increasing, even though the price
hasn’t broken out yet. The higher lows in RSI are a form of bullish divergence, which supports the
potential for an upward move.
Good luck
💥 Free signals and ideas ➡ t.me/vfinvestment
Disclaimer
The information and publications are not meant to be, and do not constitute, financial, investment, trading, or other types of advice or recommendations supplied or endorsed by TradingView. Read more in the Terms of Use.
💥 Free signals and ideas ➡ t.me/vfinvestment
Disclaimer
The information and publications are not meant to be, and do not constitute, financial, investment, trading, or other types of advice or recommendations supplied or endorsed by TradingView. Read more in the Terms of Use.