📊 Market Structure
DOTUSDT is showing a bullish recovery after a recent pullback. From the August 7th low, the price trended upward strongly, making higher highs until around August 10th, where sellers took over and drove a retracement. The correction respected multiple support levels, and buying pressure re-emerged around $3.817–$3.757, leading to the latest rally.
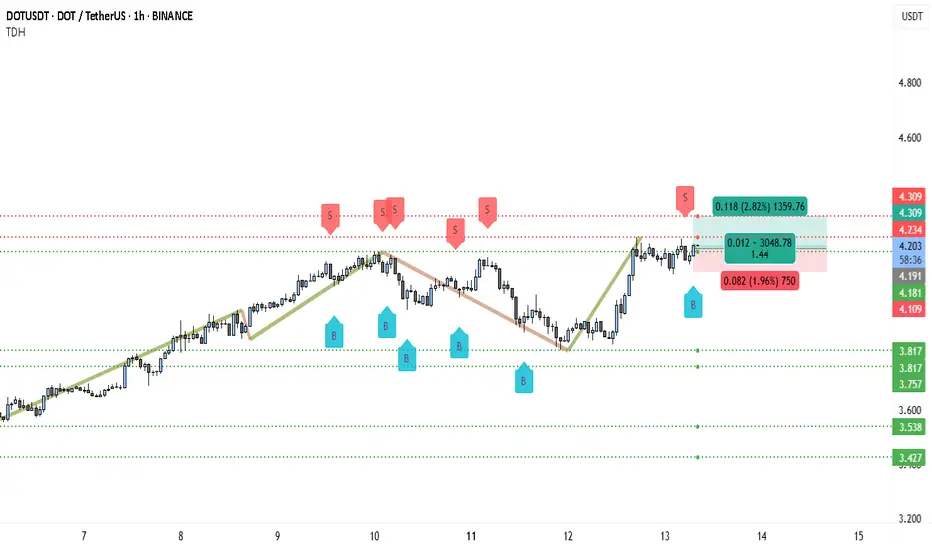
Currently, DOT is trading just above the $4.181–$4.192 zone, which is a short-term support area. This level is important because it was previously resistance during the earlier uptrend and is now holding as a pivot for bullish continuation.
________________________________________
🔍 Price Action Insights
The chart shows multiple “B” buy signals during the dip phases, confirming accumulation zones. The most recent buy signal triggered right before price pushed toward the $4.309 resistance area. Sellers have previously been active around $4.234–$4.309, which explains the minor consolidation we’re seeing now.
The immediate upside target is $4.309 — a break and close above this on the 1H would likely send DOT toward higher resistances, possibly into the $4.40 area over the next sessions.
________________________________________
💼 Trading Setup (From Chart Data)
• Entry: $4.192 (current support & breakout retest)
• Stop Loss: $4.109 (below short-term support) – Risk ≈ 1.96%
• Take Profit: $4.309 (resistance) – Reward ≈ 2.82%
• Risk : Reward Ratio: ~1.44 : 1
________________________________________
📈 Bullish Scenario
If DOT holds above $4.181–$4.192 ✅, expect a retest and possible breakout above $4.309. Breaking that resistance could trigger a stronger rally toward $4.40+, with momentum building from the prior higher low.
________________________________________
⚠️ Bearish Risk
If $4.181 breaks decisively ❌, price could revisit the lower supports at $3.817 or even $3.757 before buyers attempt another push.
________________________________________
📌 Trade Management
1. Watch for bullish candles with strong closes above $4.234 — this would be the first sign of strength toward $4.309.
2. Take partial profit near $4.309 🏦 to secure gains.
3. Move stop-loss to breakeven once partial profits are taken.
4. If a breakout above $4.309 occurs, trail the stop under each new higher low to capture extended upside.
From this setup, DOTUSDT is in a bullish recovery mode and, as long as it stays above the $4.18 pivot, buyers have the advantage.
DOTUSDT is showing a bullish recovery after a recent pullback. From the August 7th low, the price trended upward strongly, making higher highs until around August 10th, where sellers took over and drove a retracement. The correction respected multiple support levels, and buying pressure re-emerged around $3.817–$3.757, leading to the latest rally.
Currently, DOT is trading just above the $4.181–$4.192 zone, which is a short-term support area. This level is important because it was previously resistance during the earlier uptrend and is now holding as a pivot for bullish continuation.
________________________________________
🔍 Price Action Insights
The chart shows multiple “B” buy signals during the dip phases, confirming accumulation zones. The most recent buy signal triggered right before price pushed toward the $4.309 resistance area. Sellers have previously been active around $4.234–$4.309, which explains the minor consolidation we’re seeing now.
The immediate upside target is $4.309 — a break and close above this on the 1H would likely send DOT toward higher resistances, possibly into the $4.40 area over the next sessions.
________________________________________
💼 Trading Setup (From Chart Data)
• Entry: $4.192 (current support & breakout retest)
• Stop Loss: $4.109 (below short-term support) – Risk ≈ 1.96%
• Take Profit: $4.309 (resistance) – Reward ≈ 2.82%
• Risk : Reward Ratio: ~1.44 : 1
________________________________________
📈 Bullish Scenario
If DOT holds above $4.181–$4.192 ✅, expect a retest and possible breakout above $4.309. Breaking that resistance could trigger a stronger rally toward $4.40+, with momentum building from the prior higher low.
________________________________________
⚠️ Bearish Risk
If $4.181 breaks decisively ❌, price could revisit the lower supports at $3.817 or even $3.757 before buyers attempt another push.
________________________________________
📌 Trade Management
1. Watch for bullish candles with strong closes above $4.234 — this would be the first sign of strength toward $4.309.
2. Take partial profit near $4.309 🏦 to secure gains.
3. Move stop-loss to breakeven once partial profits are taken.
4. If a breakout above $4.309 occurs, trail the stop under each new higher low to capture extended upside.
From this setup, DOTUSDT is in a bullish recovery mode and, as long as it stays above the $4.18 pivot, buyers have the advantage.
Note
Plays out perfectly, profit booked!Trade forex, indices, stocks and metals with up to US$100.000 in company's funding.
Complete a challenge to access funding or go for instant deposit.
Trading involves substantial risk. Not financial advice
Complete a challenge to access funding or go for instant deposit.
Trading involves substantial risk. Not financial advice
Related publications
Disclaimer
The information and publications are not meant to be, and do not constitute, financial, investment, trading, or other types of advice or recommendations supplied or endorsed by TradingView. Read more in the Terms of Use.
Trade forex, indices, stocks and metals with up to US$100.000 in company's funding.
Complete a challenge to access funding or go for instant deposit.
Trading involves substantial risk. Not financial advice
Complete a challenge to access funding or go for instant deposit.
Trading involves substantial risk. Not financial advice
Related publications
Disclaimer
The information and publications are not meant to be, and do not constitute, financial, investment, trading, or other types of advice or recommendations supplied or endorsed by TradingView. Read more in the Terms of Use.