In recent trading sessions, 
 DOTUSDT has exhibited intriguing movements, hovering around key support and resistance levels that could dictate its short-term direction. Closing prices have shown a steady upward trajectory, culminating at $5.862, reflecting a gradual recovery from previous lows.
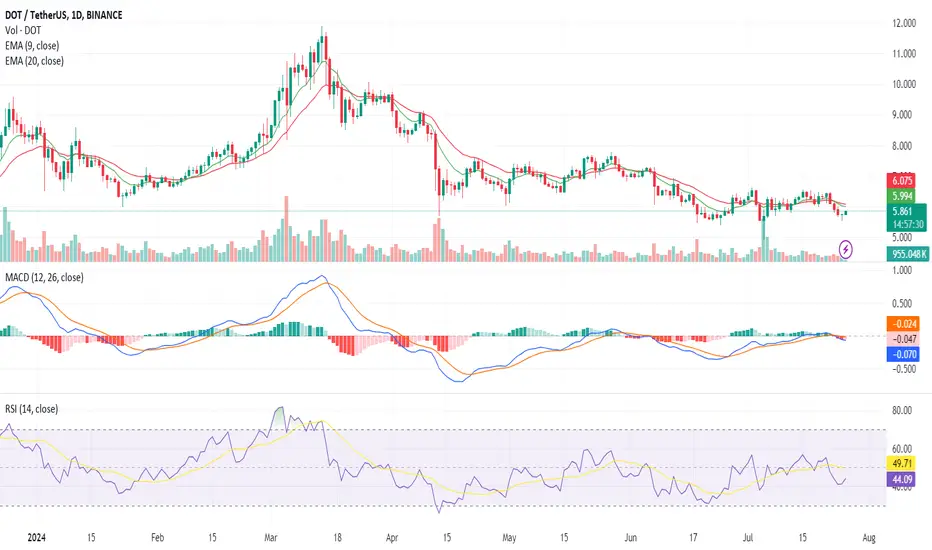
The 9 Exponential Moving Average (EMA) has been trending upward, currently at $5.797, signaling short-term bullish momentum. However, the 20 EMA, standing at $5.865, has been relatively flat, indicating a lack of strong upward pressure. The convergence of the 9 EMA towards the 20 EMA suggests potential bullish crossover, which traders typically view as a signal for upward movement.
Meanwhile, the Moving Average Convergence Divergence (MACD) indicator is currently presenting mixed signals. The MACD line has been climbing towards the signal line, moving from -0.145 to -0.098. Positive histogram values further indicate that bullish momentum is gradually increasing. However, the MACD is still in negative territory, which suggests caution as the overall momentum has not fully shifted to bullish.
The RSI has moved from oversold levels at 28.68 to a more neutral position at 46.33. This upward movement in RSI indicates waning selling pressure and a potential shift towards a more balanced market sentiment. An RSI approaching 50 often signals a possible entry point for traders anticipating upward price movement.
The immediate resistance levels are observed at $5.866 and $5.937. A break above these levels could pave the way for further gains towards $5.942 for the Polkadot crypto. On the downside, key support levels are identified at $5.829 and $5.759. A dip below these supports could lead to further downside, with $5.679 as a critical support zone.
Traders looking to go long may consider entering a position upon a confirmed breakout above $5.866, targeting the next resistance at $5.937, with a stop-loss just below $5.829 to manage risk. For those anticipating a downturn, a short position could be initiated if the price breaks below $5.759, aiming for the lower support at $5.679. A stop-loss above $5.829 would help mitigate potential losses.
While the technical indicators for the Polkadot crypto are showing early signs of bullish momentum, caution is warranted due to mixed signals from the MACD and the relative positioning of the EMAs. Traders should monitor the aforementioned support and resistance levels closely to make informed trading decisions.
Disclaimer
The information and publications are not meant to be, and do not constitute, financial, investment, trading, or other types of advice or recommendations supplied or endorsed by TradingView. Read more in the Terms of Use.
Disclaimer
The information and publications are not meant to be, and do not constitute, financial, investment, trading, or other types of advice or recommendations supplied or endorsed by TradingView. Read more in the Terms of Use.