Hello Crypto Lovers,
Mars Signals team wishes you high profits.
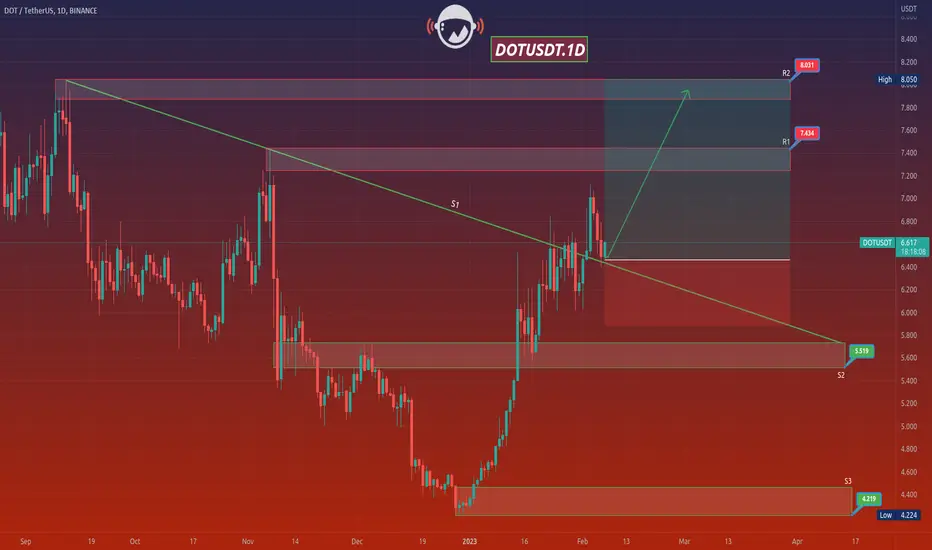
This is a one-day-time frame analysis for DOTUSDT
In this chart, R1 and R2 are our resistance areas in which the unsuccessful triumphs of price is obvious. S1 used to be a long-term resistance line. S2 used to be another resistance area in the past. And S3 is the support area with the support of price at several points. Presently, the price is fluctuating over S1 after its falling trend and we believe the price will continue its rise by having some rising signs and an increase will happen to higher amounts for the price besides the activation of the long position of the chart. But if the price is not supported at its current point, or when it reaches at R1, or even it falls below S1, definitely it would face a falling trend to lower amounts such as S2 or S3. We recommend you to have every piece of information and idea via our analyses for receiving more profitable trades.
Warning: This is just a suggestion and we do not guarantee profits. We advise you to analyze the chart before opening any positions.
Wish you luck
Mars Signals team wishes you high profits.
This is a one-day-time frame analysis for DOTUSDT
In this chart, R1 and R2 are our resistance areas in which the unsuccessful triumphs of price is obvious. S1 used to be a long-term resistance line. S2 used to be another resistance area in the past. And S3 is the support area with the support of price at several points. Presently, the price is fluctuating over S1 after its falling trend and we believe the price will continue its rise by having some rising signs and an increase will happen to higher amounts for the price besides the activation of the long position of the chart. But if the price is not supported at its current point, or when it reaches at R1, or even it falls below S1, definitely it would face a falling trend to lower amounts such as S2 or S3. We recommend you to have every piece of information and idea via our analyses for receiving more profitable trades.
Warning: This is just a suggestion and we do not guarantee profits. We advise you to analyze the chart before opening any positions.
Wish you luck
Disclaimer
The information and publications are not meant to be, and do not constitute, financial, investment, trading, or other types of advice or recommendations supplied or endorsed by TradingView. Read more in the Terms of Use.
Disclaimer
The information and publications are not meant to be, and do not constitute, financial, investment, trading, or other types of advice or recommendations supplied or endorsed by TradingView. Read more in the Terms of Use.