📌 Overview & Market Context
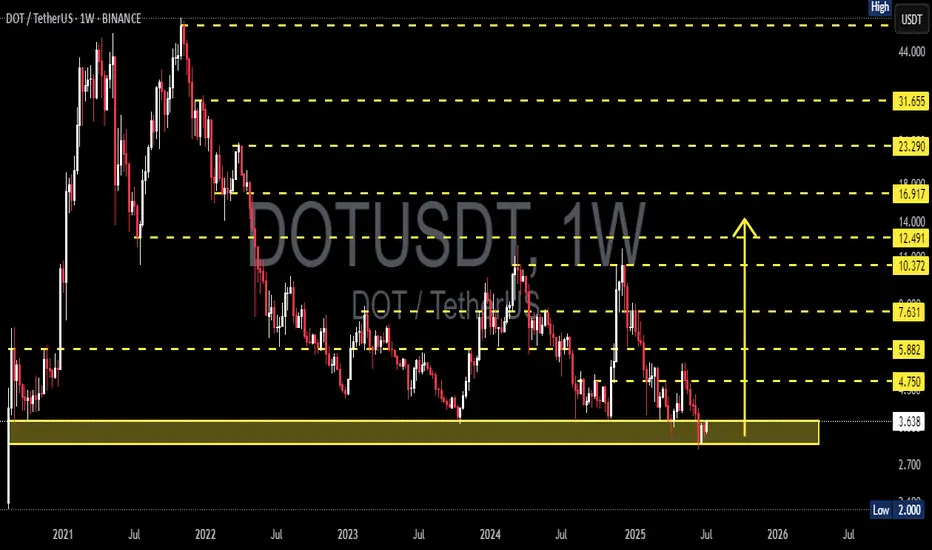
Polkadot (DOT) is currently testing one of the most critical technical zones in its price history. Price action is revisiting a multi-year demand zone between $2.70 and $3.60, which has previously served as the springboard for explosive upward moves — including the 2021 rally to all-time highs near $55.
This weekly chart reveals that DOT may be transitioning from a prolonged downtrend into an accumulation phase, often seen before major bullish expansions.
🧱 Historical Support Zone & Technical Validation
🔹 The yellow demand zone ($2.70–$3.60) has acted as a strong support multiple times since 2020.
🔹 Price has once again bounced from this area, forming a potential triple bottom or accumulation base pattern, consistent with Wyckoff Accumulation Theory.
🔹 A confirmed bullish candlestick (e.g., bullish engulfing, hammer, or long-tail doji) on the weekly timeframe could signal early institutional accumulation and a potential macro trend reversal.
🟢 📈 Bullish Scenario: Strong Reversal Potential
If DOT successfully holds this support and forms a higher low, we could see a multi-leg bullish breakout, targeting the following resistance levels:
🎯 Target Price Level Significance
TP1 $4.75 First structural breakout
TP2 $5.88 Minor historical resistance
TP3 $7.63 Previous consolidation zone
TP4 $10.37 Major weekly resistance
TP5 $12.49–14.00 Extension zone during strong rallies
🧠 Note: A move from the current level to $14 represents a potential 250%+ upside — a major opportunity if confirmed by momentum and market sentiment.
🔴 📉 Bearish Scenario: Breakdown from Historic Support
A clean break below $2.70 with high volume would invalidate the bullish setup and signal:
Breakdown from a multi-year base structure.
Possible entry into a new bearish price discovery phase.
Next psychological support at around $2.00 or lower.
This scenario could materialize if:
Bitcoin or broader crypto markets turn bearish.
Macro factors worsen.
No strong demand appears from long-term holders.
⚖️ Strategy & Investor Insights
Swing Traders: Consider aggressive entries near current levels with tight stops below $2.70.
Mid-Term Investors: This is an ideal zone for DCA (dollar-cost averaging), with attractive long-term risk-reward.
Confirmation Needed: Watch for structure breakouts above $4.75 and momentum from RSI/volume indicators.
🧠 Market Psychology: Fear Breeds Opportunity
DOT is currently in what can be described as the “boredom phase” — the stage in market cycles when most traders have given up, and smart money quietly accumulates.
As Warren Buffet famously said:
> “Be fearful when others are greedy, and greedy when others are fearful.”
#DOTUSDT #Polkadot #CryptoReversal #AltcoinSetup #TechnicalAnalysis #SmartMoneyMoves #AccumulationPhase #SupportZone #BullishCrypto #BearishBreakdown
✅ Get Free Signals! Join Our Telegram Channel Here: t.me/TheCryptoNuclear
✅ Twitter: twitter.com/crypto_nuclear
✅ Join Bybit : partner.bybit.com/b/nuclearvip
✅ Benefits : Lifetime Trading Fee Discount -50%
✅ Twitter: twitter.com/crypto_nuclear
✅ Join Bybit : partner.bybit.com/b/nuclearvip
✅ Benefits : Lifetime Trading Fee Discount -50%
Disclaimer
The information and publications are not meant to be, and do not constitute, financial, investment, trading, or other types of advice or recommendations supplied or endorsed by TradingView. Read more in the Terms of Use.