FET HTF (1D) Analysis.
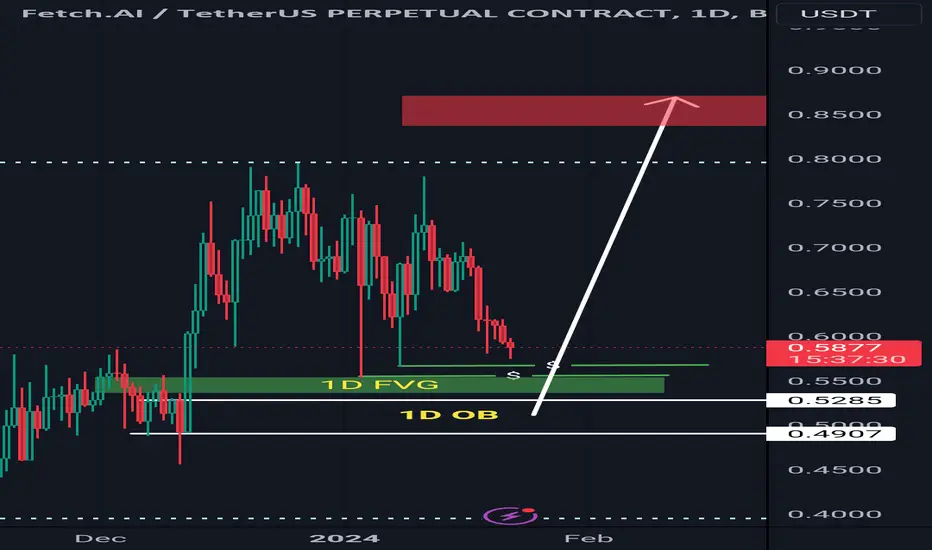
FET showed very good move in last month and now it's coming at the same impulsive point where it has formed Order block with daily FVG. Where we can see some Bullish Momentum.
And as given in Charts that shows $ liquidity below the WICKS which is also called SSL. Market can grab this liquidity before going up.
It's also a Midterm ( 4+ weeks) Spot Signal for You.
Buy in-between (0.52-0.55) and sell Above 0.650+.
Disclaimer
The information and publications are not meant to be, and do not constitute, financial, investment, trading, or other types of advice or recommendations supplied or endorsed by TradingView. Read more in the Terms of Use.
Disclaimer
The information and publications are not meant to be, and do not constitute, financial, investment, trading, or other types of advice or recommendations supplied or endorsed by TradingView. Read more in the Terms of Use.