Pair: FUN/USDT
Timeframe: 1H
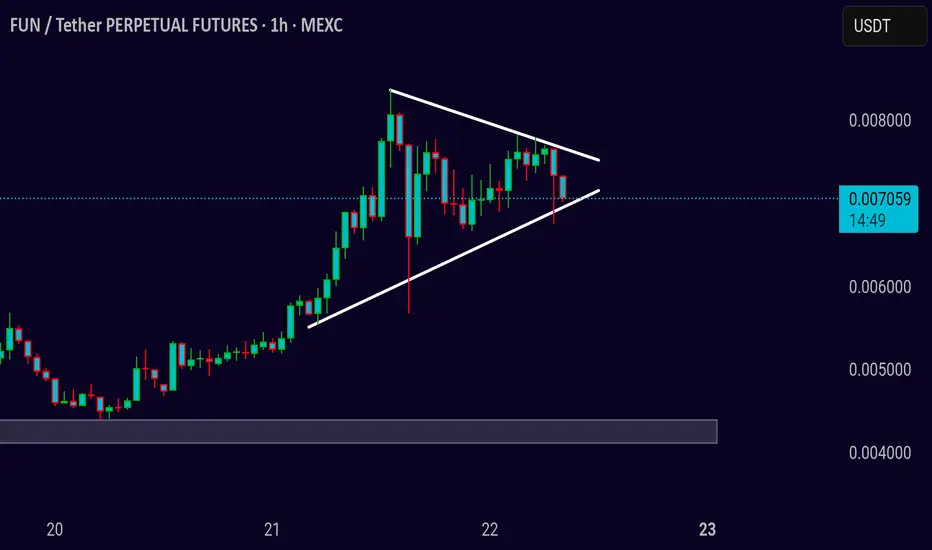
Pattern: Symmetrical Triangle
FUN is consolidating inside a symmetrical triangle, but recent candles show pressure on the lower trendline. Price is hovering around 0.0070 and just tested the ascending support. This structure usually leads to a breakout — but the direction will depend on how price reacts in the next few candles.
**Bearish Bias:**
If the price breaks and closes below the triangle with volume, we may see a quick move toward the 0.0045–0.0050 support zone. Sellers are trying to push it out of consolidation.
**Bullish Scenario:**
To shift bullish, FUN must reclaim the 0.0075 level and break above the triangle resistance. Only then a trend reversal or new rally can begin.
No confirmed breakout yet — stay patient and let the move confirm itself.
🚀 Join My Telegram Community for FREE trading signals, entry/exit points, and instant updates!
👉 t.me/cryptobyghazii
👉 t.me/cryptobyghazii
Disclaimer
The information and publications are not meant to be, and do not constitute, financial, investment, trading, or other types of advice or recommendations supplied or endorsed by TradingView. Read more in the Terms of Use.