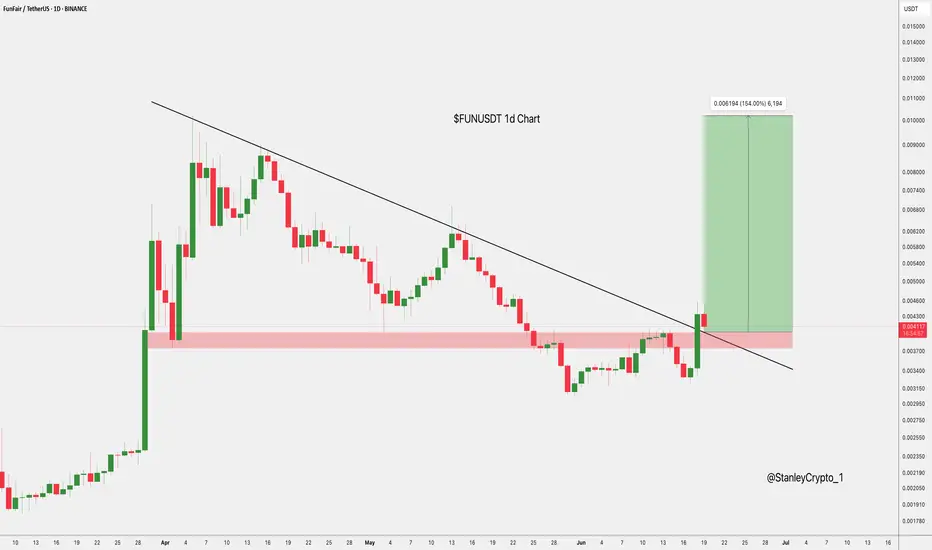
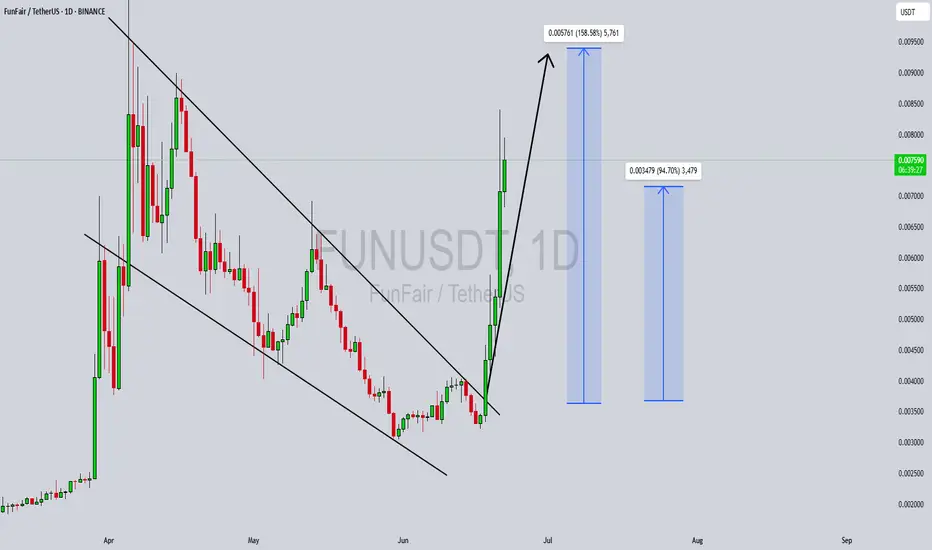
$FUNUSDT Breakout Setup NYSE:FUN has broken out of a long-term downtrend with strong bullish momentum.
It’s now retesting the breakout zone, which also aligns with a key support area.
If this level holds, the next target is 0.010199, a potential 154% move.
Clean breakout-retest setup in play.
DYRO, NFA
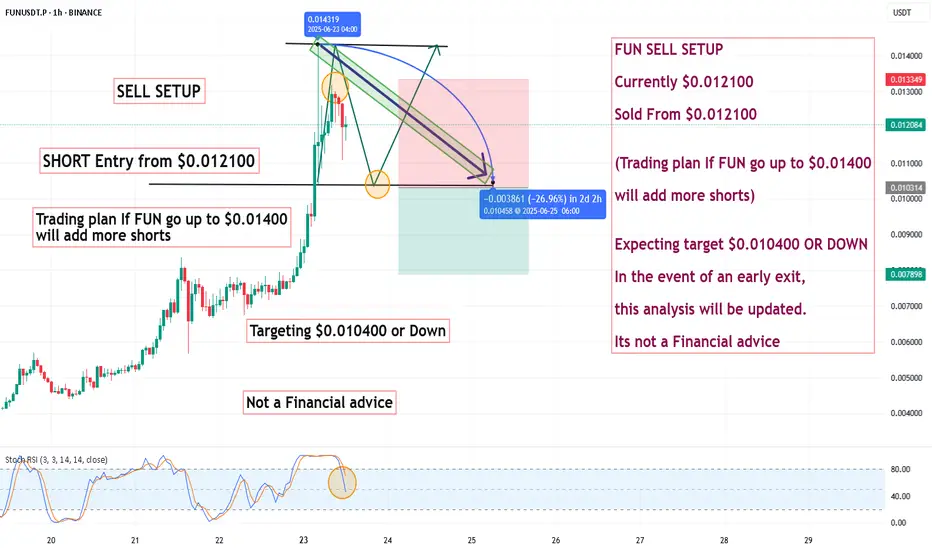
FUN SELL SETUP ,Sold From $0.012100FUN SELL SETUP
Currently $0.012100
Sold From $0.012100
(Trading plan If FUN go up to $0.01400
will add more shorts)
Expecting target $0.010400 OR DOWN
In the event of an early exit,
this analysis will be updated.
Its not a Financial advice
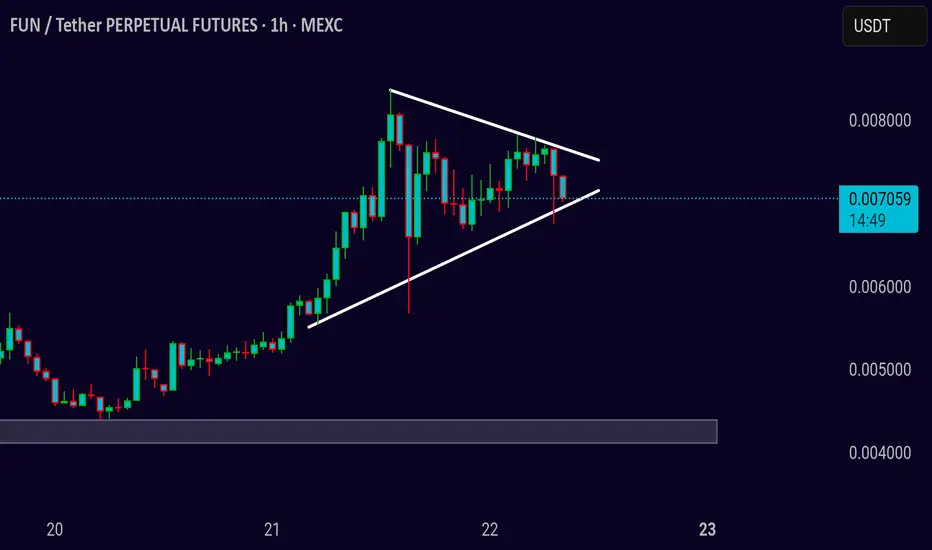
FUN/USDT – Triangle Formation Close to Breakout Point
Pair: FUN/USDT
Timeframe: 1H
Pattern: Symmetrical Triangle
FUN is consolidating inside a symmetrical triangle, but recent candles show pressure on the lower trendline. Price is hovering around 0.0070 and just tested the ascending support. This structure usually leads to a breakout — but the direct
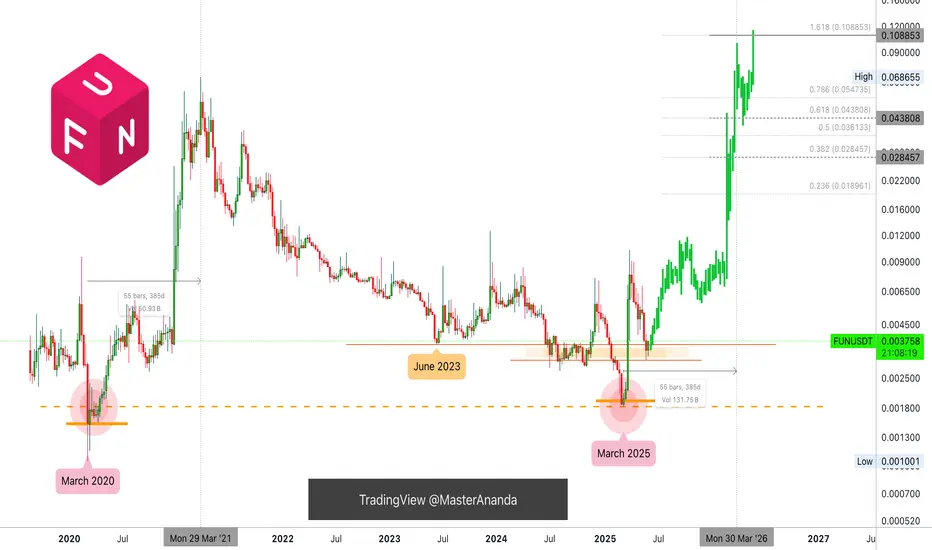
Fun Token: March 2026 New All-Time High? It Will Be FunA very strong bullish signal is present on this chart and we have some interesting price dynamics as well and a time-fractal to consider.
Good evening my fellow Cryptocurrency trader, how are you feeling today?
There was a very strong market flush recently with FUNUSDT (Fun Token), removing all LO
FUNUSDT Forming Bullish BreakoutFUNUSDT is currently showing a bullish breakout from a long-term descending channel, indicating a potential reversal and strong upside momentum building. After a prolonged downtrend within the falling structure, the price has now breached resistance with notable volume support, signaling that buyers
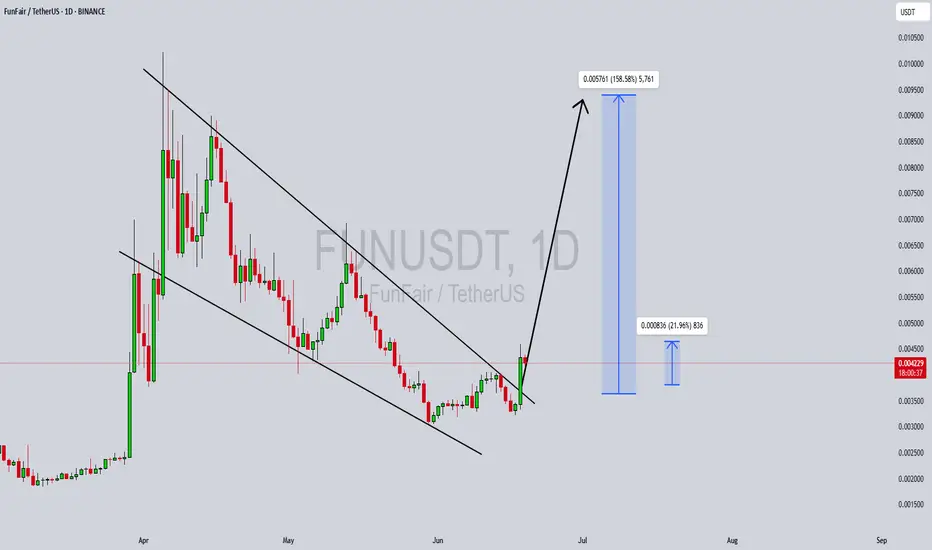
FUNUSDT UPDATEPattern: Falling Wedge Breakout
Current Price: $0.004488
Target Price: $0.0088
Target % Gain: 115.04%
Technical Analysis: FUN has broken out of a falling wedge pattern on the 1D chart with strong bullish momentum and volume spike. Breakout is confirmed with daily close above resistance trendline

FUNUSDT Forming Classic Descending ChannelFUNUSDT has recently completed a significant breakout from a classic descending channel formation, which is a strong bullish reversal pattern. This breakout, fueled by a surge in volume and bullish sentiment, signals a shift in trend after an extended downtrend phase. The price action shows a clear
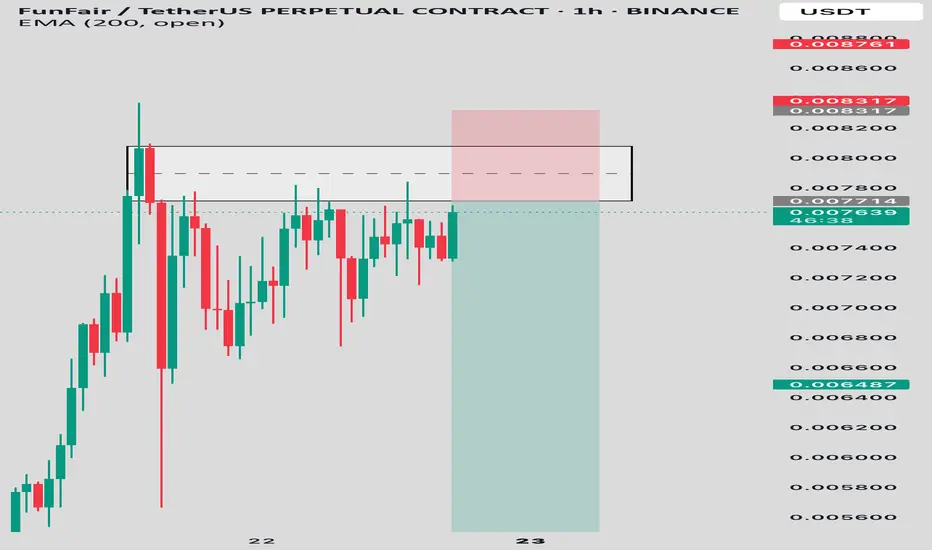
FUNUSDT SHORTAfter a strong impulsive rally, FUN/USDT tapped into a high-probability supply zone between 0.00771 – 0.00831, showing clear rejection with long upper wicks. Multiple attempts to break above the zone failed indicating buyer exhaustion and a potential reversal
• Entry: 0.00771
• Stop Loss: 0.00831
FUNUSDT Forming Falling WedgeFUNUSDT is currently forming a classic falling wedge pattern, which is widely recognized in technical analysis as a bullish reversal signal. As the price continues to compress within the wedge while holding higher volume on green candles, it suggests growing accumulation by investors. A breakout fro

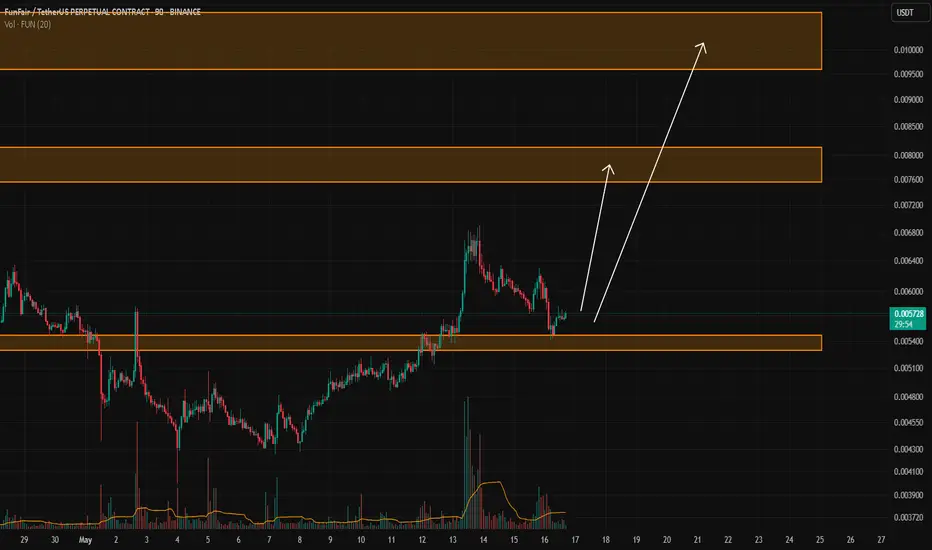
FUN/USDTKey Level Zone: 0.005300 - 0.005470
HMT v8.1 detected. The setup looks promising, supported by a previous upward/downward trend with increasing volume and momentum, presenting an excellent reward-to-risk opportunity.
HMT (High Momentum Trending):
HMT is based on trend, momentum, volume, and market
See all ideas
Summarizing what the indicators are suggesting.
Oscillators
Neutral
SellBuy
Strong sellStrong buy
Strong sellSellNeutralBuyStrong buy
Oscillators
Neutral
SellBuy
Strong sellStrong buy
Strong sellSellNeutralBuyStrong buy
Summary
Neutral
SellBuy
Strong sellStrong buy
Strong sellSellNeutralBuyStrong buy
Summary
Neutral
SellBuy
Strong sellStrong buy
Strong sellSellNeutralBuyStrong buy
Summary
Neutral
SellBuy
Strong sellStrong buy
Strong sellSellNeutralBuyStrong buy
Moving Averages
Neutral
SellBuy
Strong sellStrong buy
Strong sellSellNeutralBuyStrong buy
Moving Averages
Neutral
SellBuy
Strong sellStrong buy
Strong sellSellNeutralBuyStrong buy
Displays a symbol's price movements over previous years to identify recurring trends.