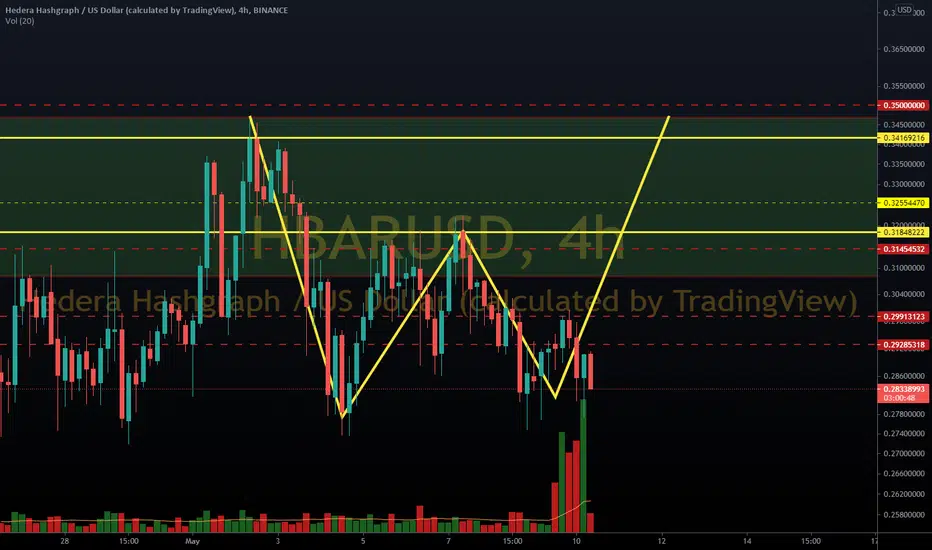
New listing just announced @ Uphold, potential contract with NASA, a bullish W (a mini-double bottom) could be taking shape here. Completion of this W woud likely flip resistance back to support (green box/area).
This would be occurring at the end of a bull flag on BTC pairing daily chart:

BTC chart idea linked below, as well as an alternate theory for the bearish scenario.
This would be occurring at the end of a bull flag on BTC pairing daily chart:
BTC chart idea linked below, as well as an alternate theory for the bearish scenario.
Note
Updated the bottom right corner of the W, should've been even w/ the bottom, added a line to denote where double bottom should occur:Order cancelled
idea invalidated, crossed below bottomRelated publications
Disclaimer
The information and publications are not meant to be, and do not constitute, financial, investment, trading, or other types of advice or recommendations supplied or endorsed by TradingView. Read more in the Terms of Use.
Related publications
Disclaimer
The information and publications are not meant to be, and do not constitute, financial, investment, trading, or other types of advice or recommendations supplied or endorsed by TradingView. Read more in the Terms of Use.