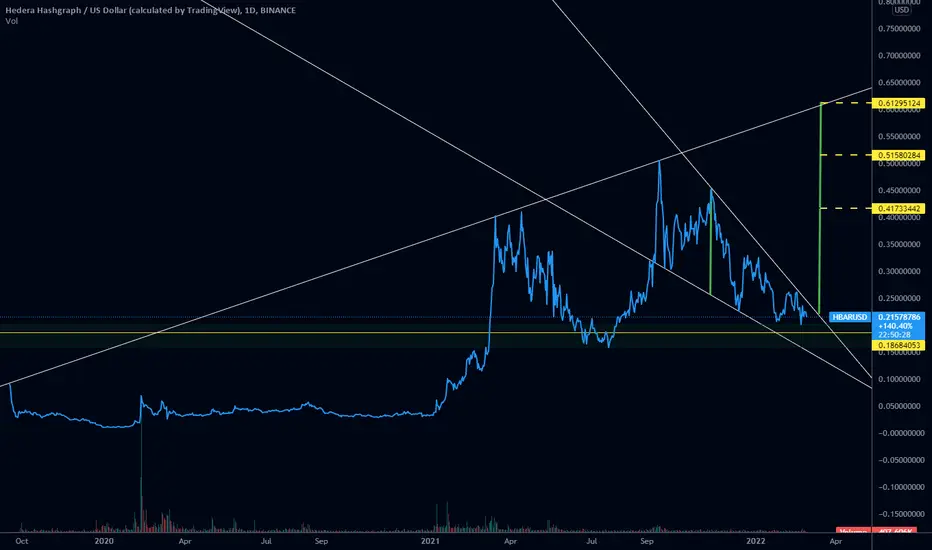
Keep above the bottom of the green box, even better above the yellow line within the green box or the top of the green box, and next up is 61+ cents.
Notice that if a trend-line is drawn connecting our market tops, it lines up with the 2x measured target for a falling wedge breakout.
Note - Typically we expect 1.5x, but crypto often does 2x. 1.5x would have us revisit ATHs in the 45-55 cents range.
Here's a couple of zoom-ins on the daily candle chart w/ the same drawings:
Note
Update, clean breakout, 3D candlestick chart below w/ RSI and MACD crossovers:Disclaimer
The information and publications are not meant to be, and do not constitute, financial, investment, trading, or other types of advice or recommendations supplied or endorsed by TradingView. Read more in the Terms of Use.
Disclaimer
The information and publications are not meant to be, and do not constitute, financial, investment, trading, or other types of advice or recommendations supplied or endorsed by TradingView. Read more in the Terms of Use.